


| Issue |
Int. J. Metrol. Qual. Eng.
Volume 17, 2026
|
|
|---|---|---|
| Article Number | 12 | |
| Number of page(s) | 21 | |
| DOI | https://doi.org/10.1051/ijmqe/2026007 | |
| Published online | 09 July 2026 | |
Research article
A multi-sensor fusion approach for real-time landslide monitoring and early warning in reservoir areas using IoT and edge computing
1
School of Intelligent Construction Chongqing Jianzhu College, Chongqing 400072, Chongqing, PR China
2
River and Ocean Engineering, Chongqing Jiaotong University, Chongqing 400074, Chongqing, PR China
* Corresponding author: This email address is being protected from spambots. You need JavaScript enabled to view it.
Received:
20
March
2026
Accepted:
26
May
2026
Abstract
Landslides are considered to be one of the most destructive among all the disastrous events. Landslides cause considerable damage to infrastructure, the environment, and loss of life, especially in mountainous and rainfall-affected areas. After the feature fusion process, the fused features are fed into a Long Short-Term Memory (LSTM) network with an optimization technique called Harris Hawks Optimization (HHA) for increased accuracy in the prediction process and computational efficiency. Additionally, a Dynamic Landslide Risk Index (DLRI) computation process is used to classify the region under surveillance into Safe, Moderate Risk, and High Risk levels. The time series data collected are processed using an edge computing architecture. The performance of the model in the regression analysis was evaluated using common regression metrics: These results show a high accuracy in landslide risk prediction. Moreover, the proposed framework presents a significant reduction in inference latency, parameters, energy consumption, and memory consumption, making it suitable for deployment in edge devices with resource constraints. Also, a real-time monitoring dashboard was implemented using multi-sensor data and DLRI. The proposed framework presents an efficient solution in the development of a real-time landslide early warning system.
Key words: Landslide prediction / edge computing / Harris Hawks algorithm / monitoring system
© L. Wang and L. Wang, Published by EDP Sciences, 2026
 This is an Open Access article distributed under the terms of the Creative Commons Attribution License (https://creativecommons.org/licenses/by/4.0), which permits unrestricted use, distribution, and reproduction in any medium, provided the original work is properly cited.
1 Introduction
Landslides are one of the most hazardous environmental hazards that can cause considerable damage to infrastructure and living organisms. Environmental changes such as rainfall, saturation of soil, and ground instability are some of the factors that increase the chances of landslides [1]. Traditionally, environmental monitoring is carried out through methods such as inspection and measurement using various sensors. However, these methods are inadequate to ensure timely risk detection [2]. ith the advent of advanced IoT technology, multi-sensor systems are being used to ensure timely environmental monitoring [3]. These systems are able to collect critical parameters such as soil moisture, soil vibration, rainfall, and ground inclination [4]. The measurement of environmental parameters through reliable instrumentation is essential for geological monitoring in landslide-prone areas. However, it has been found that gathering sensor data is not enough without proper intelligent processing mechanisms [5]. The use of edge computing has shown potential as a solution to provide real-time data processing at individual devices without relying on cloud services [6]. The use of IoT technology for sensor data fusion has shown potential to provide faster response times and minimize latency in disaster monitoring systems [7]. Moreover, sensor fusion has shown potential to use various data sources to enhance the reliability of risk estimation. Therefore, it is essential to use a combination of multi-sensor fusion and intelligent risk estimation models using edge computing to develop effective early warning systems. These models have shown potential to enhance the accuracy of landslide detection.
Researchers have developed various monitoring and forecasting methods for landslides through their work which combines sensor networks with machine learning techniques. The conventional methods use statistical analysis models together with threshold-based monitoring systems which depend on two main factors: rainfall intensity and soil moisture limits. Environmental data has been used in landslide susceptibility prediction through machine learning methods [8] methods such as Support Vector Machines (SVM), Random Forest (RF), and Artificial Neural Networks (ANN) [9] have been applied to predict landslide susceptibility using environmental data. The temporal landslide prediction process has been investigated through deep learning architectures [10] which use Convolutional Neural Networks (CNN) together with Gated Recurrent Units(GRU) for their operational framework. Some studies have used IoT sensor networks with cloud-based monitoring platforms for remote hazard detection. The methods provide valuable insights but they still face multiple restrictions. Most of these methods utilize centralized cloud processing, which causes increased latency during real-time decision-making processes [11]. Some methods only process individual sensor data without any effective multi-sensor data fusion. Most existing deep learning methods require high computational resources, making them less applicable for edge computing. Additionally, most methods are based on classification-based prediction methods rather than continuous risk evaluation [12]. These are some of the major drawbacks associated with existing methods used in reservoir monitoring systems.
In order to address these issues in existing methods, this study proposes an intelligent framework for real-time landslide monitoring in reservoir areas based on multi-sensor data fusion technology, IoT, and edge computing. Environmental sensors, including soil moisture, rainfall, vibration, and ground inclination, are integrated in the framework. A DilHeConv module is proposed to extract features from heterogeneous data. These features are further integrated using a FA-FFN. Low-frequency soil moisture, medium-frequency ground inclination, and high-frequency vibration signals are integrated in the proposed framework. Finally, an HHA-optimized LSTM is proposed and deployed on an edge device. Instead of performing binary classification, the proposed framework generates DLRI, which reflects the dynamic change in hazard levels. Moreover, an adaptive threshold-based approach is proposed to trigger early warnings if the DLRI exceeds predefined thresholds. This framework can efficiently and effectively support intelligent and efficient early warning in landslide monitoring in reservoir areas. The contribution of the research are as follows:
Develops an IoT system that uses various sensors to monitor environmental factors that contribute to landslide risk around the reservoir.
The system uses the DilHeConv feature extraction module that allows the system to extract various temporal patterns from different types of sensor data.
Introduce FA-FFN that allows the system to combine various environmental factors from different frequency ranges.
The system presents the HHA-Optimized lightweight LSTM that allows the system to perform efficient risk assessment while reducing processing requirements.
The system develops the DLRI system that uses adaptive thresholding to perform efficient disaster alerting with high accuracy.
1.1 Research scope and novelty
The scope of the research work revolves around the development of an intelligent landslide risk monitoring and early warning system through the use of IoT devices, multi-sensor data fusion techniques, and edge computing technology. The research work aims at integrating heterogeneous environmental parameters such as soil moisture content, rainfall intensity, vibration patterns, and ground inclinations with the aim of ensuring effective risk monitoring in landslide-prone areas. The novelty of the research work lies in the incorporation of a DilHeConv module with a FA-FFN in the development of an intelligent landslide risk monitoring and early warning system. Another novelty of the research work lies in the incorporation of an HHA-optimized lightweight LSTM model in the development of an intelligent landslide risk monitoring and early warning system. Contrary to the utilization of classification techniques in landslide risk monitoring systems, the research work incorporates a DLRI in the development of an intelligent landslide risk monitoring and early warning system.
1.2 Research objectives
Design an IoT framework for environmental monitoring for continuous monitoring of landslide-related parameters.
Develop a mechanism for effective feature extraction for the identification of multi-scale temporal patterns in heterogeneous data from sensors.
Develop an intelligent multi-sensor data fusion mechanism for accurate DLRI.
Develop a lightweight predictive model for edge computing for risk evaluation.
1.3 Research organization
The rest of this paper is organized as follows: In Section 2, related work on landslide prediction and various IoT-based techniques used for monitoring are presented. In Section 3, our proposed approach is discussed. In Section 4, our experiment and data set are presented, and in Section 5, our results and performance evaluation are discussed. Finally, in Section 6, our work is concluded along with future research directions.
2 Literature survey
Dang et al. [13] developed a monitoring system for landslides which uses deep learning techniques to analyze multiple remote sensing datasets that are collected from various sensors at different times in Vietnam's mountain areas. The researchers created multiple U-shaped deep learning models which include U-Net and U-Net3+to process multi-temporal Sentinel-1 SAR and Sentinel-2 optical imagery after training with the Adam optimizer for landslide detection tasks. The main purpose of the framework stays dedicated to detecting remote sensing images while it lacks the essential functions of real-time Internet of Things sensors and edge computing and ongoing risk assessment which businesses need for their emergency alert systems. Gupta et al. [14] conducted their study on landslide early warning systems through real-time hydro-geotechnical monitoring at sites throughout the Western Himalayan region. The study combined real-time hydrological and meteorological sensor data with hydrogeological slope stability modelling and a RF machine learning algorithm to predict instability through factor of safety estimation. The framework focuses primarily on hydrological modelling and slope stability analysis while it needs to develop multi-sensor fusion and deep learning-based temporal feature extraction methods and edge-based real-time risk evaluation systems for continuous monitoring. Li et al. [15] conducted a study which used time-series satellite deformation monitoring data to predict landslide displacements. The researchers developed a hybrid deep learning model which combines LSTM and Temporal Convolutional Network (TCN) to analyze InSAR-based displacement time-series data for landslide movement prediction. The method depends on satellite-based deformation data because it lacks the ability to use real-time IoT sensor networks and edge-based computation and DLRI systems which are essential for ongoing early warning systems.
Chaulya et al. [16] presented a landslide monitoring and early warning using geosensors and wireless sensor networks in hilly regions. The framework combined multiple geotechnical sensors which included crackmeters inclinometers rain gauges tiltmeters and piezometers with a wireless sensor network and multivariate statistical analysis to create a system that could predict landslides while generating alerts. The system depends on statistical analysis and existing monitoring methods because it lacks advanced deep learning models and multi-sensor feature fusion techniques and edge-based intelligent risk evaluation systems for its predictive analysis. Sharma et al. [17] presented an IoT-based smart landslide monitoring and early warning systems using cloud-enabled environmental sensing techniques. The framework used environmental sensors along with an IoT-cloud platform and ensemble learning-based techniques for efficient landslide monitoring and threshold-based alert systems for efficient disaster prediction. Nevertheless, the framework is mainly based on threshold-based techniques without considering advanced multi-feature fusion techniques, deep feature extraction techniques, and intelligent risk evaluation techniques for efficient risk analysis. The study on the application of the technique of multi-sensor remote sensing for the early detection of landslide hazards by Mao et al. [18] employed Sentinel-1 SAR images, JL1LF01A optical remote sensing images, and SBAS-InSAR deformation monitoring techniques to detect the potential areas of landslide hazards through the application of integrated remote sensing techniques. However, the proposed framework mainly deals with the application of satellite technology for the identification of landslide hazards and does not include the concept of IoT sensors, edge computing, and DLRI evaluation.
Khan et al. [19] investigated the real-time disaster monitoring and early warning systems using fog computing, machine learning, and remote sensing data for flood prediction. The study developed a fog computing-based framework integrating wireless sensor networks, Sentinel-1 and Sentinel-2 remote sensing data, and machine learning models such as LSTM and RF for real-time flood prediction and alert generation. However, the framework mainly focuses on flood hazard prediction and does not address landslide-specific multi-sensor feature extraction, advanced sensor fusion techniques, or edge-based DLRI evaluation required for real-time landslide monitoring systems. Rawat et al. [20] studied IoT-based systems for real-time landslide monitoring and prediction which help disaster management in mountainous areas. The researchers created a cloud-based monitoring system which combines hydrological data meteorological data and geographical sensor data to work with deep learning models including LSTM for landslide prediction and alert generation. The system depends on cloud-based processing and classification methods for predictions but lacks advanced capabilities to fuse data from multiple sensors and perform real-time evaluation of landslide hazards through edge computing. Bagwari et al. [21] studied LoRa-based wireless communication technology which enables IoT systems to monitor landslides in their research. The researchers built a low-power sensor node and gateway system which uses LoRa technology to send environmental monitoring. The research examined various communication metrics which include spreading factor sensitivity time-on-air energy consumption link budget and battery life to develop efficient long-range data transmission methods for situations with limited resources. The study centers its research on network communication performance yet fails to use predictive analytics and multi-sensor data fusion together with intelligent risk assessment models for superior landslide prediction and early warning capabilities.
Elmoulat et al. [22] focused on the study of landslide early warning systems that use fog edge computing and AI technology. The research proposed a framework that uses the combination of wireless sensor networks and IoT devices and AI technology and fog edge computing architecture. The framework proposed is based on the basic conceptual design without specific details on the multi-sensor feature extraction system and the advanced deep learning prediction system and the specific details on the advanced real-time risk assessment system that is essential for the accurate prediction of landslides. Al-Batah et al. [23] investigated advanced IoT-based landslide and earthquake monitoring systems using ML and CV technology. The research proposed an advanced sensor-based framework that collects environmental data on rainfall and soil moisture and vibration and slope deformation. The framework uses ML technology RF SVM KNN and CNN to analyze the collected data. The proposed framework is based on the basic concept of hazard monitoring using ML analysis technology without specific details on the advanced multi-sensor temporal feature fusion system and the advanced lightweight edge-based DL and DLRI that is essential for the accurate prediction of landslides.
2.1 Problem statement
Existing studies have explored different technologies for landslide monitoring and early warning; however, several limitations still remain. Lau et al. [24] reated an IoT and big-data monitoring system which detects rainfall-induced landslides through sensor-based displacement and vibration measurements but does not provide predictive intelligence for DLRI assessment. Nie et al. [25] introduced a multi-source big data fusion system which uses UAVs and radar and sensors to monitor environmental stability but depends on cloud processing and extensive infrastructure which creates delays during emergency responses. The remote monitoring system which Xu et al. [26] developed uses stress-strain analysis to monitor pipelines during landslide conditions, but the system focuses mostly on evaluating structural safety instead of predicting ongoing landslide hazards. Most current systems need centralized processing and traditional analysis methods, which restrict their capacity to conduct real-time intelligent risk evaluation in environments with limited resources. The proposed framework solves these problems through its integrated system which combines multi-sensor IoT data fusion with advanced temporal feature extraction and edge-based intelligent risk assessment to achieve ongoing monitoring and quicker decision processes. The proposed system enhances real-time landslide risk detection through its combination of sensor fusion methods with edge computing and deep learning risk modeling which enables more effective early warning systems than current methods.
3 Research methodology
The proposed IoT-enabled landslide monitoring and early warning framework was constructed through the use of an established methodology which this section describes. The framework operates by monitoring potential landslide events through its system which combines multiple sensor data collection with advanced feature identification and sensor data integration and local risk assessment functions. The pre-processing stage begins with raw environmental data from IoT sensors which include soil moisture and tilt and vibration and rainfall sensors. The DilHeConv module extracts important time-dependent characteristics from multi-sensor data streams. A FA-FFN system combines the extracted features to create a complete environmental condition representation. The fused features are used to calculate DLRI which determines the potential landslide risk level. The HHA based LSTM model has been optimized for deployment as a real-time risk prediction system on edge devices. The system activates an early warning system when the risk index reaches its critical threshold and maintains that level for the established time period to warn local communities and emergency responders. The system sends processed data along with alert logs to the cloud platform which stores data for future use and enables monitoring through a dashboard that displays information. The integrated methodology provides precise real-time landslide monitoring while enabling disaster management teams to implement preventive measures.
The complete structure of the designed landslide detection system together with its warning system is shown in Figure 1. The system combines IoT-driven multi-sensor data acquisition with DilHeConv-based feature extraction and FA-FFN and HHA-optimized LSTM edge risk assessment to calculate the DLRI and activate real-time alerts which operate with cloud monitoring system.
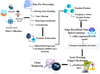 |
Fig. 1 Overall workflow of the proposed IoT-enabled landslide monitoring and prediction framework. |
3.1 Data pre-processing
The IoT-based landslide monitoring systems require data pre-processing because it helps establish dependable and consistent raw sensor data which can be used for subsequent analysis. IoT sensors use LoRa communication networks for data transmission which leads to packet loss and signal noise and time synchronization problems during data collection. The pre-processing techniques which include missing value handling and noise filtering and timestamp synchronization and feature normalization create a clean structured dataset from raw sensor data that researchers need to develop their models.
3.1.1 Handling missing values
In IoT-based monitoring systems, missing data often occurs due to packet loss during the LoRa communication. The forward filling method is used for estimating the missing data by analyzing the data points that are present around the missing data. The process of linear interpolation develops missing data points that exist between two known measurement values. It is expressed in equation (1):
 (1)
(1)
The equation defines xt as the estimated value that exists at the time t, while xt1 represents the known sensor value that exists at the previous time t1, xt2 shows the next known sensor value. The Time point shows where the value becomes absent, while t1 and t2 show the time points that surround the missing value. The method provides continuous time-series data, which enables feature extraction and risk analysis processes to be executed further.
3.1.2 Noise removal using filtering
IoT sensors produce noise because of three main reasons, which include environmental disturbances and hardware limitations, and transmission disturbances. The sensor readings require smoothing through a moving average filter because it removes high-frequency noise. It is expressed in equation (2):
 (2)
(2)
The equation defines yt as the filtered sensor value which occurs at time t while xt-1 represents the raw sensor reading that occurs at time t - i. The equation defines n as the moving window size while i represents the index of previous observations.
3.1.3 Timestamp synchronization
The different IoT sensors transmit data at slightly different time intervals. In order to align all the data from different sensors appropriately, timestamp synchronization is carried out. It can be expressed in equation (3):
 (3)
(3)
Where, Ts is the synchronized timestamp, ti is the timestamp from sensor and the number of sensors is denoted by N.
3.1.4 Data normalization
Sensor readings from different sensors vary in scale. In order to standardize the readings and optimize the performance of the model training process, the readings from the sensors are subjected to Min-Max normalization. The normalization factor can be explained in equation (4):
 (4)
(4)
Where, x′ is the normalized reading from the sensor, and x is the original reading from the sensor. The minimum and maximum readings from the feature are represented by xmin and xmax, respectively.
3.2 Feature extraction using DilHeConv module
The process of feature extraction functions as an essential component that helps researchers discover important patterns which emerge from multi-sensor IoT data that they gather in landslide-prone areas. The standard feature extraction methods struggle to identify short-term changes and long-term patterns because environmental factors like soil moisture and ground tilt together with vibration and rainfall show different patterns throughout time. The solution to this problem uses a DilHeConv module which extracts temporal features from sensor signals that have different receptive field sizes. The DilHeConv system uses convolution operations which implement multiple kernel sizes and dilation factors to detect slow and medium and fast changes that occur in multi-sensor data streams.
The architecture of the DilHeConv module used for the temporal feature extraction is shown in Figure 2. This module utilizes a mix of heterogeneous convolution kernels and dilated convolution for efficient extraction of both the short-term changes and the long-term dependencies from the multi-sensor landslide monitoring signals. The horizontal axis represents the number of N DilHeConv filters, while the vertical axis represents the number of M input channels. Some of the kernels are replaced by 1 × 1 kernels defined by (1-P), whereas the others are dilated by a dilation rate r for efficient extraction of the long-term dependencies.
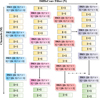 |
Fig. 2 Architecture of the DilHeConv module. |
3.2.1 Convolution-based temporal feature extraction
The initial step of the process begins with convolution operations which extract local patterns from sensor data. The standard one-dimensional convolution operation can be represented in equation (5):
 (5)
(5)
The equation defines the output signal y(t) at time t, according to the input signal x(t - i) which shows the sensor data at time t - I, and the convolution filter uses weights wi and kernel size k to process input data.
3.2.2 Dilated convolution for long-term dependency learning
The DilHeConv module uses dilated convolution to track long-term environmental changes which include gradual soil saturation and slow slope deformation. The system uses dilated convolution to expand its analysis range by increasing its temporal pattern detection capabilities without adding new model parameters. It can be given in equation (6):
 (6)
(6)
The equation defines output feature y(t) at time t through the convolution filter weight wi and input signal  which uses dilation spacing and d as the dilation factor for temporal spacing control.
3.2.3 Heterogeneous Kernel feature learning
Various environmental sensors produce signals which exhibit different patterns of signal transmission throughout time. The system shows three distinct time periods where soil moisture adjusts gradually and tilt signals show intermediate changes. The DilHeConv module uses different convolution kernels because it needs to handle different sensor types which produce various signal patterns. The equation expresses this relationship in equation (7):
 (7)
(7)
The feature map Fj represents output from sensor j while Xj represents input provided by the same sensor and kj functions as the kernel size that sensor j uses.
3.2.4 Multi-sensor feature aggregation
The researchers create an integrated environmental state representation through their combination of sensor-specific features, which they extracted. The feature vector that we aggregated contains vital landslide risk indicators, which we express through equation (8):
 (8)
(8)
The final multi-sensor feature vector F combines with soil saturation features Fsoil and ground tilt variation features Ftilt and vibration intensity features Fvib and rainfall trend features Frain. For measurement and instrumentation in geological monitoring. The high-level temporal features demonstrate critical environmental indicators, which include soil saturation index and moisture increase rate, tilt magnitude variation, vibration intensity spikes and cumulative rainfall trends. The high-level temporal features demonstrate critical environmental indicators which include soil saturation index and moisture increase rate and tilt magnitude variation and vibration intensity spikes and cumulative rainfall trends. The system uses extracted feature vectors to perform multi-sensor feature fusion which computes the DLRI value in the proposed framework.
Input: Pre-processed multi-sensor IoT data
Output: Temporal feature vector F
Step 1: Receive pre-processed sensor signals (soil moisture, tilt, vibration, rainfall).
Step 2: For each sensor signal do
If sensor type = soil moisture
Apply convolution with larger kernel to capture slow variation.
Else if sensor type = tilt
Apply convolution with medium kernel.
Else if sensor type = vibration
Apply convolution with smaller kernel to capture rapid spikes.
Else
Apply suitable convolution for rainfall trend extraction.
Step 3: Apply dilated convolution to capture long-term temporal dependencies.
Step 4: Generate sensor-specific feature maps.
Step 5: Aggregate all sensor features into a unified feature vector.
Step 6: Output the extracted temporal feature vector to the feature fusion stage.
The working procedure of the DilHeConv-based temporal feature extraction algorithm is presented in Algorithm 1. The selection of DilHeConv is based on its capability to capture multi-scale temporal patterns from heterogeneous environmental sensor signals through dilated convolution operations. This makes the model suitable for landslide monitoring, where soil moisture, vibration, rainfall, and tilt sensors exhibit varying temporal characteristics associated with landslide occurrence. In the first place, the preprocessed multi-sensor signals from the soil moisture sensor, the tilt sensor, the vibration sensor, and the rainfall sensor are used. According to the type of sensor used, different sizes for the convolutional kernels are selected by using if-else operations. This helps in effectively dealing with slow, medium, and rapid changes in environmental parameters. After that, dilated convolution is used for effectively learning the long-term temporal dependencies present in the data stream from the sensors. Next, the feature vectors extracted from each sensor are aggregated into a single feature vector for landslide risk evaluation using the multi-sensor feature fusion stage.
3.3 Multi-sensor feature fusion using FA-FFN
The multi-sensor feature fusion is an important component of the proposed landslide monitoring model. This is due to the fact that landslide occurrences are affected by various environmental factors such as soil moisture levels, slope deformation, vibration activity, as well as rainfall patterns. The data from each sensor has different time characteristics. Therefore, it is important to fuse the heterogeneous features into a uniform form to enable the accurate estimation of landslide risk. In the proposed research model, an FA-FFN is utilized to fuse the multi-scale features that were extracted from the DilHeConv module. FA-FFN is selected due to its ability to effectively integrate heterogeneous multi-sensor information by considering the frequency characteristics of environmental signals. This enables reliable feature fusion for landslide monitoring, where different sensors produce low-, medium-, and high-frequency behavioural patterns. This fusion technique dynamically assigns weight factors to each sensor feature based on the frequency characteristics of the signal.
3.3.1 Frequency-aware feature representation
The signals from environmental sensors vary in terms of their frequency components according to the physical process that the signals represent. Soil moisture changes slowly and represents low-frequency signals, tilt sensors measure the deformation of the slopes that is moderate and represents medium-frequency signals, and vibration measures sudden changes in the ground that represent high-frequency signals. The features from the sensors need to be transformed in a way that represents the frequency components. The frequency mapping function can be represented as follows equation (9):
 (9)
(9)
Where  is the frequency-aware feature representation of sensor i, Fi be the extracted feature vector from sensor i and
  be the frequency transformation function.
3.3.2 Adaptive feature weighting
The assignment of adaptive importance weights for the features of each sensor based on their relevance to landslide risk conditions follows the extraction of the frequency-aware feature representation. The weighted feature representation can be defined by equation (10):
 (10)
(10)
Where,  be the weighted feature vector, wi denotes the importance weight assigned to sensor i and Fi represents original feature vector.
3.3.3 Multi-sensor feature fusion
After the weighted features are obtained, the system uses a unified multi-sensor representation. The fusion is the integration of the features of the sensors to obtain the overall condition of the environment. This is represented in equation (11):
 (11)
(11)
Where Ffusion is the fused feature vector, N is the number of sensors, wi is the importance weight, and Fi is the feature vector. This fused feature vector represents the overall effect of the combination of the features of the various environmental parameters associated with the landslide event.
3.3.4 DLRI computation
The fused feature vector is then used to obtain a DLRI that represents the continuous risk level of the landslide event. The DLRI is computed using a unified feature representation that integrates both temporal features from sequential sensor observations and frequency-aware features derived from multi-scale feature fusion, ensuring joint modeling of time-dependent and spectral characteristics of environmental signals. The DLRI value is obtained using equation (12):
 (12)
(12)
Where, Ffusion is the fused feature vector of multi-sensor data, Wf is the weight matrix of the fusion network, b represents the Bias term, and σ is the activation function. The DLRI value ranges between 0 and 1, where values close to zero indicate Safe conditions, intermediate values represent Moderate Risk, and values close to one indicate High Risk of landslides. This helps the proposed system to monitor landslide risk in real-time in IoT environments.
3.4 Edge computing risk evaluation
Edge computing is an important component of the landslide monitoring system because the sensor data must be processed in real-time to detect potential hazards. There may be a delay in the cloud-based system due to the transmission delay of the data. Therefore, the proposed framework performs the risk evaluation on the edge device near the sensor nodes. In the proposed research, the HHA optimized LSTM model is implemented on the edge device to compute the level of landslide risk based on the multi-sensor features. HHA-LSTM is adopted because LSTM effectively captures temporal dependencies in time-series environmental observations, which are essential for landslide prediction. Harris Hawks Optimization is incorporated to optimize model parameters and improve prediction accuracy with reduced computational complexity, making it suitable for edge-based real-time early warning. DLRI is employed to transform complex sensor observations into an interpretable continuous risk index, supporting efficient landslide risk monitoring and warning generation.
3.4.1 Lightweight LSTM-based risk prediction
The edge device employs a trained LSTM model for the analysis of the temporal patterns of the fused sensor features, thereby making a prediction of the landslide risk level. The LSTM network can be used for the analysis of time-series data, as the LSTM network can learn the temporal relationships from the time-series data. The update equation of the hidden state of the LSTM model can be defined in equation (13):
 (13)
(13)
Where, ht is the hidden state at time step t, ht-1 be the hidden state from the previous time step, xt is the input feature vector at time t, Wh be the Weight matrix and  be the activation function.
3.4.2 Model optimization using HHA
The HHA optimization technique is a population-based metaheuristic optimization algorithm. This optimization technique is inspired by the hunting behavior of harris hawks. The equation to update the position of the solution using the HHA optimization technique can be written as shown in equation (14):
 (14)
(14)
Where, Xt is the current solution, Xt+1 is the updated solution, Xprey be the best solution obtained so far, E is the Escaping energy parameter and J be the Jump strength factor. The HHA optimization algorithm is used to optimize the weights of the proposed LSTM model as well as the hyperparameters of the model such as the learning rate, the size of the hidden units, and the convolutional kernels. The optimization goal is to achieve the minimum prediction error of the proposed DLRI model on the validation set while keeping the model compact. The standard LSTM model is sensitive to initial weight selection and hyperparameter configuration, which may lead to local minima and unstable convergence during training. HHA addresses this limitation by performing global search-based optimization of LSTM weights and hyperparameters. This improves convergence stability, reduces the risk of suboptimal solutions, and enhances prediction accuracy in complex multi-sensor environments.
3.4.3 Continuous dynamic risk computation
After the optimization, the lightweight LSTM model continues to process the fused sensor features received from the edge node to obtain the DLRI. This can be shown in equation (15):
 (15)
(15)
Where, DLRIt is the landslide risk index at time t, ht shows the LSTM hidden state output, and W represents the weight matrix of the output layer.
3.4.4 Adaptive threshold-based risk evaluation
To transform the risk index into a more interpretable form, the adaptive thresholding mechanism is used to obtain the final warning level. This mechanism adjusts the threshold according to the environmental status, as shown in equation (16):
 (16)
(16)
Where, T1 is the lower risk threshold, T2 is the high-risk threshold, and Rstatus be the final risk threshold. The threshold values T1 and T2 are determined using historical sensor observations and validation-based empirical analysis, where threshold ranges are selected based on observed DLRI distributions under normal, moderate, and high-risk environmental conditions to improve the reliability of landslide risk categorization. Specifically, lower DLRI values are assigned to the Safe category, intermediate values between T1 and T2 represent Moderate Risk, and higher values exceeding T2 are categorized as High Risk, enabling adaptive and interpretable risk assessment under varying environmental conditions.
3.4.5 Early warning trigger mechanism
An efficient early warning system plays a significant role in reducing the impact of landslide-related disasters by sending early warnings to people in nearby areas. In the proposed framework, the early warning system continuously tracks the DLRI calculated in the edge device. When a calculated risk value exceeds a predetermined safety threshold for a certain period, the system will trigger the early warning system. The threshold for triggering an early warning alert can be defined as follows in equation (17):
 (17)
(17)
Where, Tc be the critical risk threshold value, Δt is the duration for which the risk remains above the threshold, and τ be the minimum validation time window. Once the early warning alert is triggered, the system will trigger various alert systems, which will help in efficiently warning people in landslide-prone areas.
3.4.6 Cloud monitoring and visualization
While the edge device is responsible for real-time risk evaluation and alerts, cloud infrastructure is employed for long-term data storage, monitoring, and system management. In this approach, the cloud platform will receive processed sensor data and risk index values from the edge device and store it in a centralized database for historical analysis and further model improvement. This approach will result in a more efficient data management system, allowing for continuous monitoring of landslide-prone areas. The cloud data storage process can be expressed in equation (18):
 (18)
(18)
Where, Dcloud(t) be the data record stored in the cloud at time t, St represent the raw sensor readings at time t, Ft is the extracted feature vectors, and At denotes the alert status at time t. This cloud-based monitoring infrastructure will lead to a more efficient system for remote supervision, trend analysis, and system performance evaluation. This will further increase the reliability of the proposed IoT-based landslide early warning system.
Input: Multi-sensor IoT data streams
Output: Landslide risk status and alert notification
Step 1: Collect real-time data from IoT sensors (soil moisture, tilt, vibration, rainfall).
Step 2: Perform data pre-processing
If missing values exist → apply interpolation
Else continue processing
Apply noise filtering and normalize sensor data.
Step 3: Extract temporal features using DilHeConv module
For each sensor signal
If signal variation is slow → apply larger kernel
Else if variation is moderate → apply medium kernel
Else → apply smaller kernel
Generate sensor-specific feature maps.
Step 4: Perform multi-sensor feature fusion
Assign feature weights based on signal frequency
Combine features to compute DLRI
Step 5: Evaluate risk using HHA-optimized LSTM model at the edge device.
Step 6: Trigger early warning
If
DLRI > critical threshold for defined time window
Send SMS alert
Activate siren system
Push dashboard notification
Else
Continue monitoring.
Step 7: Send processed data to cloud platform for storage, visualization, and historical alert logging.
End
The proposed Algorithm 2 presents the general workflow of the IoT-based landslide monitoring system. The workflow is as follows: first, the real-time environmental data is collected, followed by pre-processing of the data to correct for any missing data or noise while normalizing the data. The pre-processed data is then fed into the DilHeConv module for analysis to extract significant temporal features, which are then fused to obtain the DLRI. Finally, the risk level is evaluated using an optimized LSTM model based on the HHA algorithm deployed on the edge device to send an early warning message based on the risk level obtained while storing the data in the cloud for monitoring.
4 Experimental setup
In this section, the experimental configuration for testing the proposed landslide monitoring and prediction framework is discussed. The proposed framework's experiment involves a hardware environment, a software environment, data preparation, model training configurations, and hyperparameters used during the experiment. These configurations ensure that the proposed framework is capable of handling IoT data from multiple sensors effectively for landslide prediction during monitoring.
4.1 Software and hardware configuration
The implementation and assessment of the suggested landslide monitoring system were performed by utilizing a Python-based development environment that supports a number of scientific computing packages. The experiments were conducted in a personal computing system that offers a reasonable level of processing and memory capabilities.
Table 1 describes the overall combination of software and hardware that can be utilized for implementing the suggested system. The overall software environment comprises Python and some scientific packages that can be utilized for data processing and development of deep learning models. The overall experiments were performed on a machine that comprises an Intel Core i5 processor and 8 GB RAM along with a Windows 11 Pro OS. The overall combination is adequate for executing the suggested DilHeConv and LSTM-based landslide risk prediction system.
Software and hardware configuration used for implementation.
4.2 Dataset description
The IoT LoRaWAN LandSlide Early Detection Dataset [27], used for the purpose of the current research, was collected from the developed IoT-based system for landslide monitoring, which was installed within a landslide-prone environment. The IoT-based system for landslide monitoring comprises a number of sensor nodes, which are used for measuring various environmental and geological factors related to landslides. The sensor nodes are used for transmitting the collected data to a central gateway using LoRa communication, which allows for efficient transmission over a longer distance. The collected dataset comprises various parameters related to soil moisture, ground inclination, vibration activity, rainfall, and atmospheric conditions, which are considered essential factors for landslides. For measurement and instrumentation, the MPU6050 sensor records the slope inclination and acceleration values. Additionally, a vibration sensor is used to measure sudden movements of the ground. Environmental sensors are used to measure the temperature and humidity
The recorded data is maintained in the form of Excel sheets and CSV files containing time-series data collected from the sensor nodes. The information provided by each record of the dataset includes a timestamp along with the data collected by the sensors placed at the monitoring site. The MPU6050 sensor records the slope inclination and acceleration values, which may indicate the movement of the ground. Additionally, a vibration sensor is used to measure sudden movements of the ground. Environmental sensors are used to measure the temperature and humidity of the environment. Finally, a sensor is used to detect rainfall, which may cause the slope to get saturated. During the experimental analysis of the proposed model, the collected data is preprocessed to be divided into the training set, validation set, and testing set to assess the proposed model. About 70% of the data is used to train the model, 15% to validate the model, and the remaining 15% to test the model.
4.3 Hyperparameter setting
In the suggested framework, a number of training and structural parameters were carefully selected in order to enable efficient learning from the patterns in the multi-sensor data. The parameters include training iterations, configuration of the convolution kernel, the capacity of the LSTM network, and optimization.
The hyperparameters used for the training of the proposed DilHeConv-LSTM model are presented in Table 2. The sequence length and batch size affect the input structure for the model and the efficiency of the training process, respectively. Moreover, the learning rate and optimizer affect the update rule for the model's parameters during the training procedure. Furthermore, the number of LSTM's hidden units affects the ability of the proposed model to learn temporal dependencies in the input data, while the population size for the HHA affects the optimization procedure for tuning the lightweight edge-deployable model. The selection of hyperparameter values was performed through iterative empirical tuning and validation-based performance analysis to achieve an effective balance between prediction accuracy, convergence stability, and computational efficiency. The final hyperparameter settings reported in Table 2 were selected based on stable convergence behaviour, lower prediction error, and suitability for lightweight edge deployment. A sequence length of 10 was selected to effectively capture temporal dependencies in multi-sensor observations, while a batch size of 32 ensured balanced training efficiency and computational stability. A learning rate of 0.001 enabled smooth parameter optimization, and 20 training epochs provided sufficient learning while minimizing overfitting. Furthermore, 32 LSTM hidden units were employed to effectively learn temporal patterns with reduced computational overhead. The convolution kernel sizes (7, 5, and 3) with dilation factors (4, 2, and 1) were selected to capture slow-, medium-, and fast-varying temporal patterns in landslide sensor data. In addition, the Adam optimizer, MSELoss function, ReLU, and Sigmoid activation functions were selected to ensure stable nonlinear learning and effective prediction performance, while an HHA population size of 5 supported lightweight optimization suitable for edge deployment. These hyperparameter settings significantly influenced the predictive performance of the proposed model by improving convergence stability, reducing prediction error, and maintaining computational efficiency for lightweight edge deployment.
Hyperparameter settings used in the proposed model.
4.4 Overall performance metrics
To assess the performance of the proposed landslide prediction model, various regression performance measures are employed. These measures are used to calculate the difference between the predicted landslide risk values and the actual observed values. The performance measures that are employed are MAE, MSE, RMSE, and R2 score. These measures are used for analysis of the accuracy of the proposed model prediction.
MAE measures the average absolute difference between the actual and predicted values, which is expressed in equation (19):
 (19)
(19)
Where, yi be the Actual value,  is the Predicted value and n be the total number of observations. The MSE measures the average squared difference between the actual and predicted values, which is expressed in equation (20):
 (20)
(20)
RMSE is the square root of the mean squared error, which represents the prediction error in the same unit as the target variable is represented, which is expressed in equation (21):
 (21)
(21)
The R2 measures how well the actual values are explained by the predicted values, which is expressed in equation (22):
 (22)
(22)
Let, ȳ denotes the Mean of actual values. The value of R2 anges between 0 and 1.
5 Result and discussion
This section discusses the experimental results obtained from the proposed IoT-based landslide monitoring system. The results obtained from the system are analyzed by using various visualization graphs. The performance metrics obtained from the results will help in analyzing the performance of the proposed model in DLRI prediction and real-time early warning detection using the proposed DilHeConv and HHA-optimized LSTM model.
5.1 Model training and convergence analysis
This subsection discusses the training behavior of the proposed model while learning from the data. The curves show how effectively the model learns from the data.
Figure 3a is a demonstration of the convergence of the proposed landslide prediction model during training. The training loss converges quickly in the initial epochs, and then it stays close to zero. This implies that the model is able to learn effectively from the temporal patterns of the multi-sensor data.
Figure 3b illustrates the convergence behavior of the proposed model. The graph illustrates a sharp reduction in loss for the initial training epochs, showing that the model is learning efficiently from the patterns contained within the multi-sensor IoT dataset. After a certain point, the loss reduces gradually with minor variations, indicating that the proposed model is converging to an optimal solution efficiently.
Figure 3c presents the training convergence of the proposed landslide prediction model over various epochs. The training loss reduces significantly in the initial epochs, indicating that the model learns the underlying temporal relationships present in the multi-sensor environmental data set very fast. The training loss gradually converges to zero over various epochs, indicating that the model learns very well without major training instability issues.
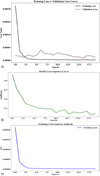 |
Fig. 3 (a) Training and validation loss curve, (b) Proposed model convergence curve, (c) Training convergence analysis. |
5.2 Prediction error and residual analysis
The performance of the prediction accuracy of the suggested model is assessed in this subsection by utilizing different error metrics and residual graphs. The graphs enable an assessment of how accurately the predicted risk data correlate to actual observed data.
Figure 4a illustrates a comparison chart for key error metrics that can be utilized in assessing the performance of the suggested landslide prediction model. The low values obtained in the error metrics show that the model offers highly accurate prediction results while analyzing the multi-sensor environment data. The results show the efficiency of the suggested model in minimizing prediction errors.
Figure 4b illustrates the distribution of residuals for the proposed landslide risk prediction model by plotting the difference between actual and predicted risk values against the predicted risk index. It is observed that most residuals are grouped closely around the reference line, which indicates that predictions made by the model are fairly accurate with minimal errors. The low mean value of residuals and standard deviation are further evidence of the reliability of the model in estimating DLRI.
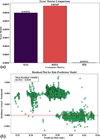 |
Fig. 4 (a) Error metrics comparison, (b) Residual plot for risk prediction model. |
5.3 DLRI prediction analysis
In this subsection, the predicted DLRI based on the proposed multi-sensor fusion model is presented. The graphs indicate the fluctuating landslide risk value over a period of time and the continuous monitoring of environmental changes by the proposed model.
Figure 5a presents the predicted DLRI over a period of time based on the proposed multi-sensor fusion model. In this figure, the red line indicates the predicted risk value over a period of time. The visualization over 500-time steps was selected based on validation-oriented temporal observation analysis to provide sufficient coverage for capturing meaningful fluctuations in environmental conditions and landslide risk patterns while avoiding excessive redundancy in visualization. The predicted value fluctuates between 0.60 and 0.63. The shaded region represents the safe, warning, and critical zones for visualizing the landslide risk threshold levels.
As shown in Figure 5b, the changing pattern of DLRI over 500-time steps based on the multi-sensor monitoring system is depicted. The red color represents some fluctuations in the risk value between 0.59 and 0.63. The changing pattern represents a stable landslide risk level. The pattern demonstrates the capability of the system in monitoring changes in landslide-prone reservoir areas.
This is clearly shown in the scatter plot in Figure 5c, where a strong linear correlation between actual and predicted values of the risk index is shown, with the R2 value being 0.9761, thus proving the accuracy of the model. The blue dots are closely aligned with the red dashed line, which represents the ideal fit line, thus proving that the HHA-Optimized LSTM model can accurately predict the landslide risk with minimal error.
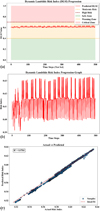 |
Fig. 5 (a) DLRI progression, (b) DLRI progression graph, (c) Actual vs predicted risk index regression plot. |
5.4 Early warning detection performance
This subsection aims to measure the effectiveness of the early warning mechanism used by the proposed system. The graphs shown demonstrate the efficiency of the system in detecting the risk situations as well as sending the early warnings when the threshold is exceeded.
Figure 6a shows the early warning detection time for the system, which is based on the signal from the predicted landslide risk over time. The blue line represents the prediction signal, while the red line represents the detected points for the system when the threshold is exceeded, thus sending the early warnings for the system. The high frequency of red detection points in the figure is attributed to the dataset segment selected for visualization, which corresponds to a sustained high-risk period with continuously elevated soil moisture, persistent rainfall, and repeated ground vibration. During such conditions, the DLRI values remain consistently near or above the threshold, leading to frequent exceedances. This reflects the realistic response of the system under prolonged hazardous conditions, not system over-triggering. Additionally, the minimum validation time window (τ) ensures only sustained exceedances trigger actual alerts, preventing false alarms. The graph shows the system's efficiency in detecting the potential risk situations.
Figure 6b presents a comparison of response delays of three different warning approaches, where it is evident that the proposed edge-based approach provides the quickest response, taking only 1.2 s, compared to the cloud-based approach, which takes 8.5 s, and manual inspection, which takes 45.0 s.
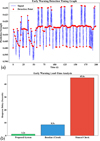 |
Fig. 6 (a) Early warning detection timing graph, (b) Early warning lead-time analysis. |
5.5 Multi-sensor correlation and feature relationship analysis
This subsection discusses the relationship between environmental sensor parameters and the computed landslide risk index. These graphs can be used to understand how various parameters affect landslide risk estimation.
Figure 7a presents a graphical representation of the relationship between soil moisture trend parameters and DLRI over 500 timestamps. The parameters are seen to be closely related, indicating that changes in soil moisture significantly affect the computed risk index. The peaks and troughs of both lines validate the proposed multi-sensor fusion approach for detecting landslides.
Figure 7b illustrates the correlation between the data trends from multi-sensor data and the DLRI based on 500 test instances, where the data magnitudes are between 0.55 and 0.85. The proximity between the lines in the figure demonstrates a high level of agreement between the aggregated data from the sensors and the calculated risk index, thereby confirming the effectiveness of the proposed sensor fusion method. The minor discrepancies between the data trends indicate that there are instances where the calculated risk index is particularly sensitive to the input from the sensors.
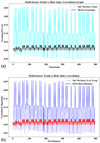 |
Fig. 7 (a) Multi-sensor trend vs risk index correlation, (b) Normalized multi-sensor correlation with DLRI across test instances. |
5.6 Real-time monitoring dashboard visualization
The proposed real-time monitoring dashboard shows the multi-sensor data collected from the landslide monitoring system. This data is shown to the users in a graphical format. This helps to monitor the environmental data.
Figure 8a, which displays the Real-Time Multi-Sensor Monitoring Dashboard (High Risk Condition), indicates a significant rise in sensor values, such as soil moisture, vibration, ground tilt, and rainfall intensity, leading to a landslide risk index of 0.72, which lies in the High-Risk Zone, implying a high probability of instability in the slopes. The early warning alert system sends a high-risk warning notification, implying that immediate precautionary measures and emergency monitoring are necessary for preventing potential landslide hazards in the concerned area.
As shown in Figure 8b, in the Real-Time Multi-Sensor Monitoring Dashboard (Moderate Risk Condition), it is clearly shown that environmental and geotechnical factors such as soil moisture, tilt, vibration, and rainfall are increased slightly compared to their normal ranges. In addition, the calculated landslide risk index is 0.42, which is included in the moderate risk zone.
As shown in Figure 8c, the real-Time Multi-Sensor Monitoring Dashboard (Safe Condition), which indicates the current environmental parameters such as soil moisture, soil tilt, soil vibration, rainfall, temperature, and humidity, are collected from the sensor devices. All sensor parameters are within a safe threshold range, and as a result, the landslide risk level is calculated as 0.34, which falls under the SAFE zone.
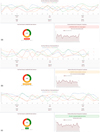 |
Fig. 8 (a) Real-time multi-sensor monitoring dashboard indicating high-risk condition, (b) Real-time multi-sensor monitoring dashboard visualization indicating moderate-risk condition, (c) Real-time multi-sensor monitoring dashboard visualization indicating safe-zone monitoring condition. |
5.7 Comparative analysis
This segment discusses a comparative evaluation of the proposed optimized HHA-LSTM model with existing deep learning techniques like IDCNN [28], Bi-LSTM [29], and Standard CNN [30]. The comparison uses various performance criteria which include computational latency and energy efficiency and model complexity and memory usage and prediction accuracy and early warning capability to assess whether the proposed framework meets requirements for real-time landslide monitoring.
5.7.1 Edge computational performance analysis
In the following subsection, the computational efficiency of various models will be discussed when implemented on edge devices. The computational efficiency will be evaluated based on the inference latency, response time, and execution speed of the models. All these factors are important for landslide monitoring systems that must be implemented in real-time.
Figure 9a shows the inference latency of various deep learning models implemented on edge devices. The proposed HHA-LSTM model has the lowest inference latency compared to IDCNN, Bi-LSTM, and Standard CNN. This again justifies the efficiency of the HHA model in reducing the complexity of the model while maintaining computational efficiency.
Figure 9b depicts a quantitative comparison of the response delays for the four deep learning models, with the Proposed HHA-LSTM model having the fastest response time. Conversely, IDCNN, Bi-LSTM, and Standard CNN models are shown to have increasing delays, which proves the effectiveness of the HHA model in minimizing the computational overhead while maintaining the prediction accuracy.
Figure 9c illustrates the inference time for various deep learning architectures, where the proposed model has the least inference time, outperforming IDCNN, Bi-LSTM, and Standard CNN architectures. This proves that the HHA efficiently simplifies the architecture of the model for deployment at the edge device to perform fast real-time landslide risk prediction.
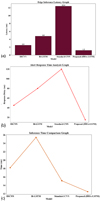 |
Fig. 9 (a) Edge inference latency comparison across models, (b) Alert response time analysis graph, (c) Inference time comparison across models. |
5.7.2 Energy and memory efficiency evaluation
This subsection assesses the resource efficiency of the proposed model in terms of energy consumption and memory usage during the deployment on the edge. Resource efficiency is a fundamental requirement of IoT-based monitoring systems running on the edge with limited resources.
Figure 10a shows the comparison of the energy efficiency of the proposed models. The energy consumption of the proposed Bi-LSTM model is 680 mJ, followed by the Standard CNN model, which is 550 mJ, and the IDCNN model, which is 420 mJ. However, the proposed HHA-LSTM model is the most efficient model since it only consumes 250 mJ.
As shown in Figure 10b, memory usage for different deep learning models when implemented on edge devices is presented, with Proposed HHA-LSTM showing memory usage as low as 1.4 MB, proving a substantial decrease in memory usage when compared with IDCNN, which uses 3.8 MB, Bi-LSTM, which uses 8.2 MB, and Standard CNN, which uses 2.1 MB, proving that the HHA model does indeed reduce the size of deep learning models for edge devices while ensuring high performance.
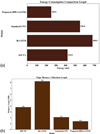 |
Fig. 10 (a) Energy consumption comparison, (b) Edge memory utilization. |
5.7.3 Model complexity and parameter optimization
In this subsection, the structural complexity of different deep learning models based on the number of parameters is discussed. It is essential to reduce the number of parameters in deep learning models for efficient edge deployment without compromising the prediction accuracy.
Figure 11 is a comparison chart for the computational efficiency of the different deep learning models based on the number of parameters used in the models. The IDCNN model comes next, followed by the Standard CNN model. On the other hand, the proposed HHA-LSTM model has the highest efficiency by drastically reducing the number of parameters.
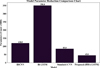 |
Fig. 11 Model parameter reduction comparison. |
5.7.4 Early warning prediction capability
This subsection assesses the ability of the proposed framework to perform an early warning based on the lead time before the possible landslide events. The ability to perform an early warning is essential to enable timely evacuation.
Figure 12 illustrates a comparison of the lead time before an actual landslide occurs based on the early warning ability of various deep learning models. The proposed HHA-LSTM achieves a lead time of 2.0 h compared to IDCNN (15.0 h), Bi-LSTM (8.0 h), and Standard CNN (4.0 h). The results reveal that not only does the optimized model process data faster, but it also achieves an early risk prediction before the possible landslide events.
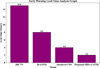 |
Fig. 12 Early warning lead-time analysis. |
5.7.5 Prediction accuracy and overall model performance
In this subsection, the accuracy of prediction for the proposed model is compared with other deep learning models used for landslide risk prediction. This analysis proves the efficiency of the optimized model by maintaining high prediction reliability.
Figure 13 shows the classification accuracy for different deep learning models. In this figure, it is clear that the Proposed HHA-LSTM has the highest accuracy at 98.2%. This proves that although the HHA has the lowest inference latency among all the deep learning models, it has the highest prediction accuracy. Hence, it is the most efficient model for landslide early warning systems.
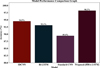 |
Fig. 13 Model performance comparison by accuracy. |
5.7.6 Edge vs cloud deployment performance
This subsection will discuss the performance difference between edge-based inference and cloud-based inference for landslide prediction model performance. Edge computing allows for faster processing since it removes delays in transmission that are present in cloud processing.
Figure 14 presents a comparison of inference latency between edge-based inference and cloud-based inference for various deep learning models, proving the superiority of edge-based inference over cloud-based inference. The Proposed HHA-LSTM model has the fastest latency in edge-based inference. This proves that HHA reduces model complexity for edge-based devices, allowing for real-time landslide early warning without delays.
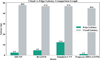 |
Fig. 14 Cloud vs edge latency comparison across models. |
5.8 Ablation study
The ablation study evaluates the contribution of each major component in the proposed landslide prediction framework. The model performance analysis involves testing different modules by removing them from the architectural design. The analysis determines the contribution of each element to the total prediction accuracy which includes feature fusion and dilated convolution and edge processing and HHA. The standard regression metrics MAE and RMSE and MSE and R2 score are used to assess the performance of the system.
Table 3 shows the ablation study results, which were obtained by removing various modules of the suggested framework. From the results, it can be concluded that all modules contribute to the improvement of the system's performance. The absence of the feature fusion module results in the worst performance, as indicated by the lowest R2 score. The absence of the dilated convolution module affects the ability of the model to learn the long-term temporal dependencies. The absence of edge processing and HHA optimization results in a decreased prediction accuracy. The suggested model performs the best, as indicated by the lowest error values and the highest R2 score, which is 0.9761.
Ablation study results of the proposed model.
5.9 Discussion
The experimental outcomes clearly show that the proposed landslide monitoring framework is effective in enhancing prediction accuracy and computational efficiency compared to existing deep learning approaches. The proposed framework is effective in capturing multi-scale temporal patterns based on IoT sensor data, including soil moisture, tilt variation, vibration signals, and rainfall indicators, through integration of the proposed DilHeConv module with the optimized HHA-optimized LSTM model. The experimental outcomes show that prediction errors are minimized, and computational efficiency is enhanced compared to existing IDCNN, Bi-LSTM, and Standard CNN approaches. This proves that the proposed framework is effective in generating accurate DLRI predictions for landslide monitoring applications.
One of the main reasons for carrying out the research is the development of an efficient landslide prediction system that is deployable on edge devices with a high level of prediction accuracy. The integration of HHA results in a reduction in the number of model parameters. This makes the model more efficient. From a theoretical point of view, the research contributes to the advancement of AI-based disaster monitoring systems. This is due to the efficiency of the integration of heterogeneous temporal feature extraction with the application of metaheuristic optimization [31]. This helps the system to identify short-term environmental changes as well as long-term environmental trends [32]. From a practical point of view, this proposed framework offers a reliable early warning system that is capable of sending timely alerts for disaster prevention and risk mitigation. The lightweight model ensures timely monitoring in remote areas that are landslide-prone despite possible connectivity issues [33]. However, this study also has some limitations, including the limited dataset that was obtained from a few sensor nodes, which may be affected by possible environmental noise during practical implementation. Future studies could be directed towards increasing the dataset in various geographical locations, including other environmental parameters, in order to increase its robustness and generalization ability.
6 Conclusion and future work
In this research work, an intelligent landslide prediction framework has been proposed based on the IoT-based monitoring data set with the integration of deep learning and optimization. The proposed framework has been developed with the integration of DilHeConv for feature extraction and an LSTM-based prediction model with the optimization of HHA. The integration of environmental and geotechnical sensor data sets like soil moisture, tilt variation, vibration, rainfall, temperature, and humidity help the model to effectively predict the temporal patterns for landslide risk. The experimental results show that the proposed HHA-LSTM-based landslide prediction model has a high prediction accuracy with an MAE of 0.00299, RMSE of 0.00340, MSE of 1.16 × 10⁻⁵, and an R2 score of 0.9761. In addition to that, the optimized architecture results in reduced computational complexity and inference delay. The reduced energy consumption makes the framework suitable for real-time deployment on resource-constrained edge devices. The results obtained in this study show the possibility of using the integration of data from IoT-based monitoring and light deep learning techniques for effective landslide early warning systems. The proposed framework can help in faster detection and response times for landslide risks, which can be very effective in disaster mitigation for landslide-prone areas. The use of HHA results in reduced model parameters while achieving high performance.
Despite the good results obtained in this study, some limitations can be identified in the current study. The data set used for model evaluation is obtained from a limited monitoring setup. The generalization capability of the model might be affected by such a limitation. Future studies can be carried out by increasing the data set by considering data from different monitoring setups. Additional environmental factors such as groundwater level, density of the soil, and geology can also be taken into consideration. Future studies can also be carried out by using deep learning techniques and edge computing for better accuracy.
Funding
Chongqing Municipal Natural Science Foundation of China:Research on Risk Assessment and Information Monitoring and Early Warning of Landslide Disaster in Wushan Section of Three Gorges Reservoir Area (No: CSTB2023NSCQ-MSX0907).
Key Project of Science and Technology Research Program of Chongqing Municipal Education Commission: Research on Deep Learning Driven Intelligent Early Warning System for Rainfall-type Landslides in the Three Gorges Reservoir Area (No: KJZD-K202504301).
National Natural Science Foundation of China:Study on the Mechanism of Rock Mass Degradation and Microbial Modification Reinforcement in the Water Level Change Zone of Three Gorges Reservoir (No: U22A20600).
Conflicts of interest
The authors declare that there are no conflicts of interest regarding the publication of this paper.
Data availability statement
The data used in this study are available from the corresponding author upon reasonable request.
Author contribution statement
Liying Wang conceptualized the study, developed the methodology, and wrote the manuscript, while Linfeng Wang contributed to data analysis, validation, and manuscript review.
Ethical approval
This study does not involve human participants or animals and therefore does not require ethical approval.
Informed consent
All authors have read and approved the final manuscript and consent to its publication.
References
- Q. Zhang, T. Wang, Deep learning for exploring landslides with remote sensing and geo-environmental data: frameworks, progress, challenges, and opportunities, Remote Sens. 16, 1344 (2024) [Google Scholar]
- Mr. A.S. Patil, Smart IoT system for landslide prediction and monitoring, Int. J. Sci. Res. Eng. Manag. 09, 1–9 (2025) [Google Scholar]
- Joshi, S. Agarwal, D.P. Kanungo, R.K. Panigrahi, Integration of Edge–AI into IoT–Cloud Architecture for landslide monitoring and prediction, IEEE Trans. Ind. Inform. 20, 4246–4258 (2024) [Google Scholar]
- P. Arora, R. Wason, U.S. Thakur, D. Arora, M.N. Hoda, Real time environmental sensing for landslide risk reduction using IoT and AI in Joginder Nagar hills, Int. J. Inf. Technol. 17, 5483–5496 (2025) [Google Scholar]
- H. Yulia, S. Pramono, Sutrisno, B.D. Jati, IoT based early warning system of landslide and flood disasters, AIP Conf. Proc. 2674, 030041 (2023) [Google Scholar]
- R. Chang, B. Li, J. Dang, C. Yang, A. Pan, Y. Yang, Real-time intelligent detection system for illegal wearing of on-site power construction worker based on edge-YOLO and low-cost edge devices, Appl. Sci. 13, 8287 (2023) [Google Scholar]
- M. Jawalkar, N. Malviya, P. Hage, S. Chakule, P. Pattewar, IoT based landslide detection and monitoring system, Int. J. Res. Appl. Sci. Eng. Technol. 10, 3396–3399 (2022) [Google Scholar]
- F.S. Tehrani, M. Calvello, Z. Liu, L. Zhang, S. Lacasse, Machine learning and landslide studies: recent advances and applications, Nat. Hazards, 114, 1197–1245 (2022) [Google Scholar]
- M. Moavi, H. Elmizadeh, M. Entezari, Modeling landslide susceptibility using artificial neural network algorithm: a case study of Shahid Abbaspour Dam Basin, Northeast Khuzestan, Geogr. Environ. Hazards, 14, 38 (2025) [Google Scholar]
- J.S. Gidon, J. Borah, S. Sahoo, S. Majumdar, M. Fujita, Bidirectional LSTM model for accurate and real-time landslide detection: a case study in Mawiongrim, Meghalaya, India, IEEE Internet Things J. 11, 3792–3800 (2024) [Google Scholar]
- L. Huang, D. Li, H. Yan, K. Wang, Z. Huang, Dual-window fusion filtering with adaptive anomaly correction for real-time GNSS landslide monitoring, Meas. Sci. Technol. 36, 096104 (2025) [Google Scholar]
- N. Casagli, E. Intrieri, V. Tofani, G. Gigli, F. Raspini, Landslide detection, monitoring and prediction with remote-sensing techniques, Nat. Rev. Earth Environ. 4, 51–64 (2023) [Google Scholar]
- K.B. Dang et al., Deep learning models integrating multi-sensor and -temporal remote sensing to monitor landslide traces in Vietnam, Int. J. Disaster Risk Reduct. 105, 104391 (2024) [Google Scholar]
- K. Gupta, N. Satyam, Integrating real-time sensor data for improved hydrogeotechnical modelling in landslide early warning in Western Himalaya, Eng. Geol. 338, 107630 (2024) [Google Scholar]
- J. Li, C. Fan, K. Zhao, Z. Zhang, P. Duan, Landslide displacement prediction using time series InSAR with combined LSTM and TCN: application to the Xiao Andong landslide, Yunnan Province, China, Nat. Hazards, 121, 3857–3884 (2025) [Google Scholar]
- S.K. Chaulya, P.K. Mishra, N. Kumar, V. Kumar, V.K. Rawani, Landslide monitoring and prediction system using geosensors and wireless sensor network, Discov. Geosci. 2, 6 (2024) [Google Scholar]
- Sharma, R. Mohana, A. Kukkar, V. Chodha, P. Bansal, Retracted article: an ensemble learning–based experimental framework for smart landslide detection, monitoring, prediction, and warning in IoT-cloud environment, Environ. Sci. Pollut. Res. 30, 122677–122699 (2023) [Google Scholar]
- J. Mao, Q. Su, Y. Zhu, Y. Xiao, T. Yan, L. Zhang, Multi-sensor remote sensing for early identification of loess landslide hazards: a comprehensive approach, Appl. Sci. 15, 6890 (2025) [Google Scholar]
- M.A.R. Khan, N. Sultana, M.S. Akter, Development of a fog computing-based real-time flood prediction and early warning system using machine learning and remote sensing data, J. Sustain. Dev. Policy, 01, 144–169 (2025) [Google Scholar]
- P.S. Rawat, A. Barthwal, Landslide monitor: a real-time landslide monitoring system, Environ. Earth Sci. 83, 226 (2024) [Google Scholar]
- S. Bagwari, A. Roy, A. Gehlot, R. Singh, N. Priyadarshi, B. Khan, LoRa based metrics evaluation for real-time landslide monitoring on IoT platform, IEEE Access, 10, 46392–46407 (2022) [Google Scholar]
- M. Elmoulat et al., Towards landslides early warning system with fog - edge computing and artificial intelligence, Int. J. Ubiquitous Syst. Pervasive Netw. 15, (2021) [Google Scholar]
- M. Al-Batah, M. Alzboon, H. Migdadi, M. Alkhasawneh, M. Alqaraleh, Advanced landslide detection using machine learning and remote sensing data, Data Metadata, 3, (2024) [Google Scholar]
- Y.M. Lau et al., Monitoring of rainfall-induced landslides at Songmao and Lushan, Taiwan, using IoT and big data-based monitoring system, Landslides, 20, 271–296 (2023) [Google Scholar]
- W. Nie, J. Chen, D. Song, L. Dong, X. Liu, E. Wang, Three-dimensional intelligent monitoring and early warning technology for tailings ponds based on spatiotemporal fusion of multisource big data, Environ. Monit. Assess. 196, 1081 (2024) [Google Scholar]
- Q. Xu, K. Song, H. Liu, W. Zheng, S. Dong, L. Zhang, Remote real-time monitoring and early warning of pipeline status under landslide conditions based on stress–strain analysis, ASCE-ASME J. Risk Uncertain. Eng. Syst. Part Civ. Eng. 10, 04023060 (2024) [Google Scholar]
- N. Pukrongta, B. Kumkhet, S. Nilnoree, T. Suksawat, T. Pechrkool, V. Pirajnanchai, Data for: an IoT-based multi-sensor monitoring system with LoRaWAN for landslide early detection in risk-prone areas, 1, (2025), https://doi.org/10.17632/9w43sg73bt.1 [Google Scholar]
- L. Nava et al., Landslide displacement forecasting using deep learning and monitoring data across selected sites, Landslides, 20, 2111–2129 (2023) [Google Scholar]
- P.S. Rawat, A. Barthwal, Landslide monitor: a real-time landslide monitoring system, Environ. Earth Sci. 83, 226 (2024) [Google Scholar]
- F. Ofli et al., Landslide detection in real-time social media image streams, Neural Comput. Appl. 35, 17809–17819 (2023) [Google Scholar]
- T. Bostan, Generating a landslide susceptibility map using integrated meta-heuristic optimization and machine learning models, Sustainability, 16, 9396 (2024) [Google Scholar]
- C. Ye, H. Wu, T. Oguchi, Y. Tang, X. Pei, Y. Wu, Physically based and data-driven models for landslide susceptibility assessment: principles, applications, and challenges, Remote Sens. 17, 2280 (2025) [Google Scholar]
- K. Halder et al., Improving landslide susceptibility prediction through ensemble recursive feature elimination and meta-learning framework, Sci. Rep. 15, 5170 (2025) [Google Scholar]
Cite this article as: Liying Wang, Linfeng Wang, A multi-sensor fusion approach for real-time landslide monitoring and early warning in reservoir areas using IoT and edge computing, Int. J. Metrol. Qual. Eng. 17, 12 (2026), https://doi.org/10.1051/ijmqe/2026007
All Tables
All Figures
|
Fig. 1 Overall workflow of the proposed IoT-enabled landslide monitoring and prediction framework. |
| In the text | |
|
Fig. 2 Architecture of the DilHeConv module. |
| In the text | |
|
Fig. 3 (a) Training and validation loss curve, (b) Proposed model convergence curve, (c) Training convergence analysis. |
| In the text | |
|
Fig. 4 (a) Error metrics comparison, (b) Residual plot for risk prediction model. |
| In the text | |
|
Fig. 5 (a) DLRI progression, (b) DLRI progression graph, (c) Actual vs predicted risk index regression plot. |
| In the text | |
|
Fig. 6 (a) Early warning detection timing graph, (b) Early warning lead-time analysis. |
| In the text | |
|
Fig. 7 (a) Multi-sensor trend vs risk index correlation, (b) Normalized multi-sensor correlation with DLRI across test instances. |
| In the text | |
|
Fig. 8 (a) Real-time multi-sensor monitoring dashboard indicating high-risk condition, (b) Real-time multi-sensor monitoring dashboard visualization indicating moderate-risk condition, (c) Real-time multi-sensor monitoring dashboard visualization indicating safe-zone monitoring condition. |
| In the text | |
|
Fig. 9 (a) Edge inference latency comparison across models, (b) Alert response time analysis graph, (c) Inference time comparison across models. |
| In the text | |
|
Fig. 10 (a) Energy consumption comparison, (b) Edge memory utilization. |
| In the text | |
|
Fig. 11 Model parameter reduction comparison. |
| In the text | |
|
Fig. 12 Early warning lead-time analysis. |
| In the text | |
|
Fig. 13 Model performance comparison by accuracy. |
| In the text | |
|
Fig. 14 Cloud vs edge latency comparison across models. |
| In the text | |
Current usage metrics show cumulative count of Article Views (full-text article views including HTML views, PDF and ePub downloads, according to the available data) and Abstracts Views on Vision4Press platform.
Data correspond to usage on the plateform after 2015. The current usage metrics is available 48-96 hours after online publication and is updated daily on week days.
Initial download of the metrics may take a while.