| Issue |
Int. J. Metrol. Qual. Eng.
Volume 16, 2025
|
|
|---|---|---|
| Article Number | 2 | |
| Number of page(s) | 13 | |
| DOI | https://doi.org/10.1051/ijmqe/2024021 | |
| Published online | 20 January 2025 | |
Research Article
Measurement of wettability and surface roughness for metrology and quality control in microfluidics
1
Danish Technological Institute (DTI), 8000 Aarhus C, Denmark
2
Laboratoire National de Métrologie et d'Essais (LNE), 78190 Trappes, France
3
Centre Technique des Industries Aérauliques Et Thermiques (CETIAT), 69100 Villeurbanne, France
4
IMT Masken und Teilungen AG (IMTAG), 8606 Greifensee, Switzerland
5
Instituto Português da Qualidade (IPQ), 2829-513 Caparica, Portugal
* Corresponding author: This email address is being protected from spambots. You need JavaScript enabled to view it.
Received:
25
April
2024
Accepted:
16
December
2024
Abstract
Microfluidics is a rapidly growing technology with applications in biochemistry and life sciences. To support the ongoing growth there is a need for common metrology, quality control, and standardisation. Here measurements of wettability and surface roughness can contribute, and these quantities affect flow characteristics of devices, bonding processes in manufacturing, and special microfluidic mechanisms such as droplet formation and spreading of fluids on surfaces. To quantify wettability, an optical laboratory setup was used to measure liquid drop contact angles of three liquids on a microfluidic surface. To further quantify wettability, the Owens, Wendt, Rabel, and Kaelble model was applied to contact angle measurements to determine the total surface free energy. To quantify surface roughness, atomic force microscopy and stylus profilometry measured area roughness parameter and profile roughness parameter for four samples of microfluidic surfaces. The wettability methods successfully demonstrated measurements of contact angles, and these methods were applied to determine a value for the total surface free energy. AFM and stylus profilometry successfully determined surface roughness parameters, and the determined values agreed with the expected for the material. In conclusion, the demonstrated methods can contribute to metrology, quality control and standardisation in microfluidics.
Key words: Microfluidics / wettability / surface roughness / metrology / quality control / standardisation
© T.S. Daugbjerg et al., Published by EDP Sciences, 2025
 This is an Open Access article distributed under the terms of the Creative Commons Attribution License (https://creativecommons.org/licenses/by/4.0), which permits unrestricted use, distribution, and reproduction in any medium, provided the original work is properly cited.
1 Introduction
Microfluidics is the technology of manipulating small amounts of fluid using microchannels where one of the transverse dimensions are smaller than 1000 μm [1,2]. The microchannels are typically embedded in a thin slide, often denoted a chip, and often made of polymer or glass. Noteworthy applications of microfluidics are inkjet printing [3,4], a microscale system for gas chromatography [5], an array of capillary electrophoresis channels for DNA sequencing [6,7], contributions to the Human Genome Project [8,9], and organ-on-a-chip systems with cultures of living cells in channels to simulate organ tissue in drug trials [1]. Further examples of applications and technology are available in the review by Convery and Gadegaard [1].
Different materials are used in microfluidic chips, and the capabilities of microfluidic devices depend on materials and their properties [10]. Thermoplastic polymers are an often-used material, for example cyclic olefin copolymers (COC) and copolyester thermoplastic elastomer (COP), and these are suitable for mass production techniques such as injection moulding [11]. Glass types, e.g. borosilicate glass D236® bio or D236® T eco, are also commonly used with advantages for devices requiring chemical stability, high temperature, or high pressure [12]. The manufacturing of glass chips can involve techniques such as glass substrates, wet etching, and bonding of multiple glass plates [12].
Wettability and surface roughness, both defined in materials and methods, are relevant material properties that can influence the operation and manufacturing of microfluidic devices. Wettability describes the ability to maintain contact between a liquid and a solid surface [13]. In microfluidic devices associated with droplet mechanisms the surface wettability is a fundamental characteristic affecting the dynamic behaviour of droplet generation and evolution [14]. Greater wettability has been shown to enhance the flow of a fluid displacing another fluid, in a microfluidic system with multiple fluid phases and a porous medium [15]. Wettability is also an important characteristic for microfluidic devices relying on spreading of a fluid for chemical or biological reactions on a surface or in a microchannel [16]. According to the classical description of a stable laminar flow, wettability has no effect on the flow in a microchannel [17]. However, multiple studies have reported an experimental microchannel friction factor higher than that predicted by the classical description [18–20]. Li et al. propose a modified apparent viscosity model for microscale flows based on molecular theory and wetting theory [18]. In that model, the friction factor increases with increasing wettability, and a greater pressure difference would be needed to drive a flow in a microchannel with greater wettability.
Surface roughness may be loosely described as the surface irregularities that makes a surface not smooth. For definitions of surface texture and surface roughness parameters see ISO 25179-2 [21] and ISO 21920-2 [22]. According to the classical description of a stable laminar flow, surface roughness does not affect the flow in a microchannel [17]. However, there are studies where the pressure difference needed to drive a flow in a microchannel is larger than expected from classical laminar flow theory [23–25]. These studies refer that the observed excess flow resistance is an effect of the surface roughness of a microchannel. Thus, higher surface roughness may increase the pressure difference needed to drive a given flow through a microchannel.
In summary, different values of wettability may help facilitate special mechanisms in different types of microfluidic devices. Smooth surfaces and low wettability can lead to microchannels where lower pressure differences are needed to drive the flow, which may improve flow performance, and reduce risks of leaks and burst of microfluidic devices and interfaces [26]. Furthermore, surface roughness is important for microfluidic manufacturing involving bonding of multiple glass or polymer layers, where it can be more difficult to bond rougher surfaces successfully [27]. The goal of this study is to demonstrate accurate measurement and evaluation of wettability and surface roughness, and thus help optimising and standardising the performance of microfluidic devices. Stakeholders from industry, academia and government have recognized that microfluidics has unanswered needs regarding universally accepted metrology, quality control, and standardisation [28,29]. Thus, this study makes a novel contribution to the important effort of advancing quality control, standardisation and harmonisation in the field of microfluidics [28,29].
The experimental results presented in this study have also been communicated in reports of the MFMET project, and these reports are available on the Zenodo general purpose open repository [30–35]. Furthermore, this work was inspired by some of these reports [30–32].
2 Materials and methods
2.1 Samples
Table 1 lists the five samples of glass slides used in this study. Sample 1 was used for wettability measurements, and it had a flat surface of the material D263® bio, with thickness 1 mm, width 25 mm, and length 75 mm. IMTAG in Greifensee, Switzerland, provided sample 1 in a sealed box.
Table 1 also lists sample 2–sample 5, which were used for surface roughness measurements, and these were glass slides of D263®bio with width 25 mm and length 52.6 mm provided by IMTAG in Greifensee, Switzerland. From the perspective of microfluidic manufacturing these glass slides are unbonded glass substrates. Sample 2–sample 4 had two open channels made by wet etching, see Figure 1. These three samples had the surface types bonding surface and channel surface. Sample 5 was a glass slide with only bonding area and no channels.
Samples of glass slides investigated in this study.
 |
Fig. 1 Selected glass slides from Table 1, and locations of surface roughness measurements. The open channels in sample 2–sample 4 are 100 μm deep and 9.5 mm wide. Sample 1 is not shown in this figure, because it was used for wettability measurements only. A) Sample 2–sample 4 had measurements with atomic force microscopy made at the indicated locations. B) Sample 2–sample 4 had stylus instrument measurements made at the indicated locations. C) Sample 5 had stylus instrument measurements made at the indicated locations. |
2.2 Measurements of wettability on microfluidic surfaces
ISO 19403-1 [13] defines quantitative measures of wettability, i.e. the contact angle θ of a liquid drop resting on a solid surface, and the total surface free energy of a solid surface σs. The contact angle is the angle between the drop base and the tangent of the liquid-atmosphere interface at the three-phase point, see Figure 2. The total surface free energy of a solid surface is energy or tension arising from forces on the solid surface from interactions between molecules, see Figure 2. While not used as a direct measure of wettability, the total surface tension of the liquid σl is an important quantity, which describes energy or tension arising from forces on the liquid surface from interactions between molecules, see Figure 2. As explained below, the contact angle θ depends on both the liquid and the solid surface, while the total surface free energy of a solid surface is a material quantity that depends only on the surface.
ISO 19403-1 [13] and ISO 19403-2 [36] describe a method to measure the contact angle, and a method to determine the total surface free energy. In the context of microfluidic chips, it is worth noting that these methods address a drop on a flat surface, and not inside a microchannel. As such, the contact angle and total surface free energy in this study characterise liquids and surfaces, rather than the geometry of a channel. There exists research and publications which discuss measuring the contact angle inside channels or tubes [37–42]. However, at the time of this study there was heterogeneity and ambiguity among these methods, and to support wide applicability and standardisation this study did not use them.
The measurements of contact angle were performed at the liquid flow laboratory at CETIAT in Villeurbanne, France. The measurements used sample 1, see Table 1, and three liquids were used: water, di-iodomethane, and ethylene glycol. Figure 3 shows the laboratory setup that measured the contact angles on a flat surface. To comply with the test conditions described in ISO 19403-2 [36], the laboratory setup operated not exposed to vibrations, intense air flows, or intense light from the outside. Furthermore, the setup was oriented horizontally, equilibrated with the room temperature that was within (23 ± 2) °C, and the room's relative humidity was within (50 ± 5)%.
The glass slide was placed in a sample holder, and the position adjusted to place it in the lower half of the image of the microscope camera. The slide holder was positioned between the microscope camera and a source of white diffused lighting, see Figure 3. The test liquid was prepared and filled in a clean and bubble-free syringe. The cannula of the syringe was moved to the top of the image, and the image was adjusted for focus, contrast, and brightness. Carefully, the syringe placed a drop on the glass slide, and the microscope magnification was adjusted to make the drop take up about 2/3 of the image.
The laboratory setup was calibrated with the calibration standards CP24 from KRÜSS [43]. The standards are a set of contact angle shapes printed on glass slides, and they accurately follow theoretical drop shapes according to Young-Laplace. The Young-Laplace equation can be found in ISO 19403-1 [13]. The calibration standards allow calibration of contact angles with an accuracy of Uangle standard = 0.1° [43]. Contact angles were measured by manually evaluating captured images with the software ImageJ [44]. For this calibration three measurements of the contact angle were made for each of the three standards with reference contact angle values 30°, 60°, and 120°.
This study used the Owens, Wendt, Rabel, and Kaelble (OWRK) model to determine the total surface free energy of the solid surface [13,36]. The OWRK model originates from application of adsorption theory to describe the wettability of a solid surface with a liquid [13,45,46]. The theory formulates a state of equilibrium for the three-phase point, see Figure 2. This equilibrium involves quantities such as the contact angle, the total surface free energy of the solid surface, and the total surface tension of the liquid [13].
The OWRK model assumes that polar interactions and disperse interactions dominate other molecular interactions [13,45,46]. Thus, the model describes the total surface free energy of the solid surface σs, as the sum of the polar surface free energy of the solid surface σsp and the disperse surface free energy of the solid surface σsd [13,45,46]. Likewise, it describes the total surface tension of the liquid σl as the sum of the polar surface tension of the liquid σlp and the disperse surface tension of the liquid σld [13,45,46]:

 (1)
(1)
Finally, the OWRK model formulates the equilibrium with the following linear equation [13,36]:
 (2)
(2)


 (3)
(3)
In summary, application of the OWRK model enabled determination of the total surface free energy of the solid surface σs as follows. Two or more liquids with known values of total surface tension σl, disperse surface tension σld and polar surface tension σlp, were placed on the solid surface and contact angles θ were measured. In this study, the surface tension values were obtained from ISO 19403-2 [36,47]. The literature and measured values enabled calculation of x and y, as stated in equation (3), and a linear equation of the form in equation (2) was fitted to x and y. From the fit parameters m and b, the polar surface free energy of the solid surface was derived as σsp = m2, and the disperse surface free energy of the solid surface was derived as σsd = b2. As stated in Equation 1 the total surface free energy of the solid surface was found by adding the disperse and polar contributions. It can be inferred from equations (2) and (3) that if all else is equal, a drop will have a smaller contact angle on a solid surface with a greater total surface free energy. The contact angle is illustrated in Figure 2.
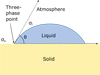 |
Fig. 2 Illustration of a liquid drop resting on a solid surface. In the three-phase point the solid, liquid, and atmosphere (containing vapour) are in contact. Also shown in the illustration are the contact angle θ, the surface tension of the liquid is σl, and the surface free energy of the solid surface σs. Source: Redrawn from ISO 19403-1 [13]. |
 |
Fig. 3 The laboratory setup at CETIAT in Villeurbanne, France, for measuring contact angles on a flat surface. A − white diffused lighting, B − slide under test, C − slide holder, D − high resolution microscope camera. Image credit: CETIAT. |
2.3 Measurements of surface roughness on microfluidic surfaces
The area roughness parameter Sa is defined as the arithmetic mean of the absolute value of the height z(x,y) over the investigated surface A [21], see equation (4).
 (4)
(4)
Similarly, the profile roughness parameter Ra is defined as the arithmetic mean of the absolute value of the height z(x) over a line le on the investigated surface [22,48], see equation (5).
 (5)
(5)
Notice that equations (4) and (5) use the absolute value of the height, so peaks and valleys of a surface do not cancel each other out. Furthermore, the height in equations (4) and (5) is referenced with the mean of the surface, and ISO 25178 describes filters applied to surface data prior to calculation of roughness parameters [21].
2.3.1 Atomic force microscopy
Atomic force microscopy (AFM) is a technique for imaging three-dimensional surface topographies at the nanometre scale [49–51]. AFM scans a sample by moving a sharp physical probe over the surface, while measuring the interaction forces between the probe and the surface [49,51]. In AFM an important force for this interaction is the interatomic weak force called van der Waals force [50,51]. The sharp probe is attached to a small arm denoted a cantilever, and during a scan either the cantilever or the sample is moved by a very precise positioning system, e.g. a piezoelectric scanner [52]. The interaction between the probe and the surface is determined by measuring the vertical motion of the probe, e.g. using a laser beam deflection system [49,52]. In one operating mode the probe is in contact with the sample, and this so-called contact-mode could damage the surface or the tip. A special operating mode of AFM is denoted tapping-mode, where the cantilever vibrates vertically above the surface (∼300 kHz typically), probing the interaction forces by the changes in amplitude and phase of the oscillation can reveal information about the vertical height of the sample surface [49,50,52]. This mode is preferred for surface roughness measurements, avoiding the smoothing of the tip or the surface during acquisition of images.
This study employed a Veeco Dimension 3100 atomic force microscope [52] and a Bruker AFM probe OTESPA R3 [53], and these measurements were made at LNE in Trappes, France. The typical tip radius of OTESPA R3 is 7 nm. The NanoScope software controlled the acquisition of measurements [52]. The AFM was in tapping-mode with cantilever amplitude, cantilever frequency, gain, and resolution adjusted according to manufacturer recommendations [52]. The measurement campaign was carried out after and before a calibration check to ensure the traceability of the height measurement. This calibration was realised with a P900H60 standard (nominal pitch 900 nm, nominal height 60 nm) [54]. Furthermore, the measurements were made after a few hours of thermalisation, and the protective housing closed. The AFM scans were made in a scan area of 5 μm by 5 μm, 1024 pixels by 1024 pixels (pixel size 4.9 nm), and scan speed 4 μm/s (scan rate 0.5 Hz).
Following measurements, the software MountainsLab (Digital Surf) processed the raw images with the following operations [55]: line to line levelling, thresholding to exclude possible dust or residue on the surface, and calculation of the area roughness parameter Sa according to ISO 25178 [56,57]. No additional filters were used.
Sample 2 to sample 4 were used for surface roughness measurements with AFM. Each sample had three measurements in channel 1, the bonding area, and channel 2, see Figure 1.
2.3.2 Stylus profilometry
Stylus profilometry measures the topography of a surface by physically probing the surface with a stylus tip mounted on a probe arm [58–60]. The stylus profilometer operates with the application of a small force, which makes the stylus tip physically touch the surface [60]. The stylus is typically in the shape of a cone ending in a spherical tip, and typically the tip is made of diamond and has radius of a few micrometres [59,60]. The stylus scans the surface of a sample by movement provided by a drive unit, typically comprising a motor and gearbox [60]. The vertical motion of the stylus is electrically detected, e.g. with a transducer device [60].
This study employed a Mahr reference measuring station MarSurf GD 140, which scans surfaces with constant velocity and constant force between surface and stylus tip [61] to give quantitative information on heights with respect to position. These measurements were made at IPQ in Caparica, Portugal. Figure 4 shows the MarSurf probe arm with the stylus scanning over the channel surface of one of the samples at the IPQ laboratory. To comply with the MarSurf GD 140 instrument's specifications, the parameters were set to probe arm length 45 mm, measuring force 0.030 N, spherical tip radius 2 μm, vertical measuring range −250 μm to +250 μm, maximum vertical resolution 0.2 nm, and measuring speed 0.10 mm/s [61].
Following the measurements, data analysis was made with the MarWin EasyRoughness software from Mahr. The settings for the evaluation of the surface texture of the profile of the samples were based on the informative annex D of ISO 21920-3:2021 [62], as the samples were produced in a research framework and therefore have no nominal values. Furthermore, the following measurement configuration parameters were used: total profile length 0.56 mm, section length 0.08 mm, and evaluation length le = 0.4 mm [22]. That analysis enabled the evaluation of several parameters besides profile roughness parameter Ra. These were the height parameters: root mean square height Rq, skewness Rsk, kurtosis Rku, and total height Rt [22], and these were the feature parameters maximum height Rz, mean peak height Rp, and mean pit depth Rv [22]. ISO 21920-2:2021 explains these parameters in greater detail [22].
Sample 2 to sample 5 were used for surface roughness measurements with stylus profilometry. Sample 2 to sample 4 had nine profile measurements made in channel 1 and channel 2, see Figure 1. Finally, sample 5 had nine profile measurements made in the bonding area, see Figure 1. The choice of nine measurements was based on, and exceeded, the recommendation of five sections in the informative annex D of ISO 21920-3:2021 [62].
 |
Fig. 4 The MarSurf GD 140 stylus instrument at IPQ, Caparica, Portugal, during the measurement of surface roughness parameters of a sample. Image credit: IPQ. |
3 Results
3.1 Measurements of wettability on microfluidic surfaces
Table 2 shows results from calibration of the laboratory setup for contact angle measurements.
From the results in Table 2, the measurement uncertainty of contact angle measurements was determined to U(k = 2)contact angle = 1°, using the below formula:
 (6)
(6)
In equation (6), Uangle standard is the accuracy of the angle standard as defined in materials and methods,  and σE are respectively the average of errors and standard deviation of errors, as defined in Table 2. In equation (6), k = 2 is the coverage factor, and its value implies a 95% confidence level for the uncertainty.
Table 3 presents the results from contact angle measurements of the three liquids on the surface of sample 1. For each average contact angle  , the uncertainty was evaluated following JCGM [63], and the contributors to the uncertainty evaluation were: the standard deviation of the contact angles θ for each liquid and Ucontact angle from equation (6).
Table 4 shows values of x and y, see equations (1)–(3), calculated from the average contact angles in Table 3 and liquid surface tensions tabulated in ISO 19403-2 [36,47]. The uncertainty of y was determined following JCGM by propagating uncertainty for y in equation (3) [63], and the contributor to the uncertainty evaluation was: the uncertainty of the average contact angle  from Table 3.
Figure 5 shows fitting of a linear equation to the values of x and y, and the caption of Figure 4 presents the fit parameters. The R-squared value is close to 1 and indicates a decently successful fit [64], though it is important to notice that the R-squared statistic does not consider the uncertainty of data. If one compares data uncertainty and the fitted linear equation in Figure 5, there is a clear discrepancy between data and fit. The fitting procedure aimed to mitigate this by using scale_covar=True in LMFIT, so the width of the confidence band and uncertainties of the fit parameters were scaled according to the discrepancy [65].
Using equation (1), equation (3), and the fit parameters from Figure 5, calculations were made of the polar surface free energy of the solid surface σsp, and the disperse surface free energy of the solid surface σsd, and the total surface free energy of the solid surface σs. The associated uncertainties were evaluated following JCGM by propagating uncertainty for σsp, σsd, σs in equations (1) and (3) [36,63], and the contributors to the uncertainty evaluation were: the fit parameter b and m from Figure 5. Table 5 displays the results.
Values of x and y. The uncertainties Uy are stated with a 95 % confidence level (k = 2). These results were also communicated in reports of the MFMET project [32,33]. Also shown are values, yfit, from the fit in Figure 5 and a comparison of y and yfit with Z-score [64] using uy = Uy/2. The discussion has further details on the Z-score comparison.
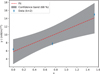 |
Fig. 5 Plot of values of x and y. Uncertainties of y, b and m have a 95 % confidence level (k=2). A linear equation with confidence band was fitted using LMFIT [65], and the fit parameters are: intercept b = (6 ± 3) (mN/m)1/2 and slope m = (5 ± 4) (mN/m)1/2. The R-squared of the fit is R2=0.87. These results were also communicated in reports of the MFMET project [32–34]. |
3.2 Measurements of surface roughness on microfluidic surfaces
Table 6 shows results from surface roughness measurements with AFM, and given the resulting uncertainties this method effectively resolved the nanometre scale of the observed surface roughness. The uncertainty of Sa was evaluated following JCGM [63], and the contributor to the uncertainty evaluation was: the standard deviation of three measurements from the same surface, see Figure 1. Figure 6 shows topographic 2D surfaces from selected measurements with AFM.
Table 6 shows the results from surface roughness measurements with stylus profilometry, and given the resulting uncertainties the profile roughness parameter Ra effectively resolved the nanometre scale of the observed surface roughness. Apart from Ra, Table 6 also shows the parameters Rq, Rsk, Rku, Rt, Rz, Rp, and Rv from stylus profilometry, and these were introduced in the materials and methods section, and they will be discussed further in the discussion section. The uncertainty of all parameters associated with stylus profilometry was evaluated following JCGM [63], and the contributor to the uncertainty evaluation was: the standard deviation of nine measurements from the same surface, see Figure 1.
Results of surface roughness measurements by AFM and stylus profilometry. The samples and locations of measurements are shown in Figure 1. The uncertainties have a 95 % confidence level (k = 2). No AFM results were available from the channel surfaces of sample 4, or from sample 5. No stylus profilometry results were available from the bonding surface of sample 2 − sample 4. These results were also communicated in reports and a data set of the MFMET project [31,32,34,35].
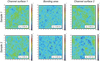 |
Fig. 6 Topographic surfaces of selected measurements with AFM. Samples and surface types can be compared with Table 1 and Figure 1. For each pair of sample and surface, three AFM measurements contributed to the AFM averages presented in Table 6. These results were also communicated in reports of the MFMET project [31,34]. |
4 Discussion
The materials and methods described methodology that can be used as test protocols in microfluidics. A test protocol to determine the wettability of a surface was demonstrated on sample 1, a surface of D263® bio glass, and with three liquids: water, di-iodomethane and ethylene glycol. The measurement system for contact angles was calibrated using traceable angle standards. The results of measured contact angles are presented in Table 3, and the determined surface free energy of sample 1 is presented in Table 5. Notice the relatively large uncertainties of the surface energies, which derived from the discrepancy between fit and data, see Figure 5. Here, LMFIT was used with scale_covar=True, so the discrepancy contributed to the uncertainties of fit parameters and in turn to the uncertainties of the determined surface free energies in Table 5. Given the discrepancy, it is important to be critical towards the reliability of the result in Table 5, and it was not possible to make precise claims about the values of surface free energies.
The discrepancy between fit and data could be explained by an underestimation of measurement uncertainties. The uncertainty of y derived from propagation of the uncertainty of contact angle θ. In turn, the uncertainty of θ was estimated using the standard deviation of reproduced measurements and the measurement uncertainty from the calibration of the contact angle laboratory setup. Table 4 quantitatively compares y uncertainties and y values from data and fit. Assuming the fit is correct and considering the values of Z-score, the uncertainties of y may have been underestimated by a factor of 4.2 to 11.1. Considering the values and uncertainties in Table 3, it seems doubtful that all this underestimated uncertainty could come from the contact angle measurements. Indeed, uncertainties greater by a factor of 4.2 to 11.1 could exceed the values of θ in Table 3, and that large uncertainties cannot be justified by observations. Another possibility is that the uncertainties in Figure 5 were underestimated because the values used for surface tension of liquids did not account for uncertainty. Analysis of propagation of error [63] for y in equation (3), using values applicable to water for θ, σl, σld, suggested that surface tension uncertainties of order of magnitude ≈1 mN/m (corresponding to a relative uncertainty of ≈1%) would dominate the uncertainty contributions to y, and exceed the uncertainties reported in Table 4. However, the widespread practise of reporting and using surface tension values without uncertainty makes it difficult to investigate this further [36,66–68]. It is also possible that some data in Figure 4 is an outlier due to an experimental mishap related to the cleanliness of the surface, placing the drops, or issues with liquids or photographs. This study made measurements of wettability in the fall of 2022. While this study was in review, ISO 19403-2:2017 [47] was updated to ISO 19403-2:2024 [36], and this update removed the use of ethylene glycol as a test liquid. It is possible that the data from ethylene glycol was an outlier, because of an issue with ethylene glycol. For example, ethylene glycol is hydroscopic and it changes surface tension with increasing water content [47]. Future studies may investigate further underestimated sources of uncertainty or practises to reduce the occurrence of outliers.
IMTAG communicated that the glass of sample 2–sample 5 was produced to have a surface roughness below 0.5 nm. The surface roughness was however expected to increase from various steps during manufacturing, so values larger than 0.5 nm were expected. The AFM measurements produced surface roughness values in the range 0.46–0.60 nm, which was similar to the surface roughness specified by IMTAG. Looking in Table 6, the bonding surface appeared to have slightly lower surface roughness than the channel surface. Looking at Figure 6, it appeared that the channel areas were more homogenous, while the bonding area had more changes in surface topography over smaller distances. Based on the AFM results, it can be argued that manufacturing steps associated with the channels, e.g. wet etching, increased the surface roughness by a low amount (≈0.1 nm). Low surface roughness is a positive situation for later steps in manufacturing, e.g. bonding processes, and it is positive for the later applications where a microfluidic flow is contained by the channel surfaces.
The measurements with stylus instrument in Table 6 showed slightly higher values of profile roughness parameter Ra than area roughness parameter Sa with AFM in Table 6. However, it was not possible to directly compare the two parameters because of some key differences between the AFM method and the stylus profilometry method. First, AFM measured the surface roughness as a mean over two dimensions, while stylus profilometry measured it as a mean over one dimension. Second, the scanning ranges were different with AFM scanning 5 μm by 5 μm, and stylus profilometry scanning 560 μm. Hence, the two methods measured surface roughness on different scales. Finally, the tip radius of AFM was 7 nm, while the tip radius of stylus profilometry was 2 μm, and thus the two methods see the surface roughness with different levels of detail. With these considerations, differences are expected between the two methods.
Models exist for the relationship between surface roughness and wettability [69–71]. Wenzel stated that wettability is affected by surface roughness and introduced the Wenzel roughness factor accordingly [69,70]. In that model, a higher surface roughness is associated with an increased contact angle for otherwise chemically similar surfaces. The work by Cassie and Baxter extended the relationship between wettability and surface roughness to porous surfaces, where the liquid drop and solid surface may not be in full contact, but leave small pockets of air [71]. Cassie and Baxter discussed examples where a surface with a regular grid of fibres was associated with a large contact angle and water-repellency [71]. In this study, the feature parameters Rz, Rp, and Rv, see Table 6 and the materials and methods section, partly described the mean peaks and pits of the surfaces, and this was partly related to the relationship between surface roughness and wettability. In that perspective, Hongru et al. evaluated the Wenzel roughness factor of several surfaces using laser scanning confocal microscopy, albeit not they did not measure wettability which was the objective of this study [72].
In conclusion, this study presented methods which can be used as test protocols for wettability and surface roughness in microfluidic manufacturing of devices. These quantities are important in microfluidics, and they may affect flow characteristics, bonding processes, and special mechanisms such as droplet generation, multiple fluid phases in a porous medium, and spreading of fluid. Such test protocols can help the microfluidic industry in facilitating robust quality control, characterisation of devices, validation of devices, and standardised metrology.
Acknowledgments
The authors would like to acknowledge all administrative and technical support for the MFMET project at DTI, LNE, IPQ, CETIAT, and IMTAG.
Funding
This project 20NRM02 MFMET has received funding from the EMPIR programme co-financed by the Participating States and from the European Union's Horizon 2020 research and innovation programme. Funder name: European Metrology Programme for Innovation and Research. Funder ID: 10.13039/100014132. Grant number: 20NRM02 MFMET.
Conflicts of interest
We have no conflicts of interest to disclose.
Data availability statement
Processed data associated with this article is available in two reports and a deliverable on the Zenodo general purpose open repository [30–32].
Author contribution statement
Conceptualization, Loïc Crouzier, Florestan Ogheard, Christina Pecnik and Elsa Batista; Methodology, Loïc Crouzier, Alexandra Delvallée, Pedro Neves, Florestan Ogheard, Kevin Romieu and Fernanda Saraiva; Software, Thomas Schrøder Daugbjerg, Alexandra Delvallée, Florestan Ogheard and Kevin Romieu, Fernanda Saraiva; Validation, Thomas Schrøder Daugbjerg, Florestan Ogheard, Kevin Romieu, Fernanda Saraiva and Elsa Batista; Formal Analysis, Thomas Schrøder Daugbjerg, Loïc Crouzier, Alexandra Delvallée, Florestan Ogheard, Kevin Romieu, Fernanda Saraiva and Elsa Batista; Investigation, Thomas Schrøder Daugbjerg, Loïc Crouzier, Alexandra Delvallée, Florestan Ogheard, Kevin Romieu, Fernanda Saraiva and Elsa Batista; Resources, Loïc Crouzier, Alexandra Delvallée, Pedro Neves, Florestan Ogheard, Christina Pecnik, Kevin Romieu, Fernanda Saraiva, Elsa Batista; Data Curation, Thomas Schrøder Daugbjerg, Alexandra Delvallée, Florestan Ogheard, Kevin Romieu, Fernanda Saraiva and Elsa Batista; Writing − Original Draft Preparation, Thomas Schrøder Daugbjerg; Writing − Review & Editing, Thomas Schrøder Daugbjerg, Alexandra Delvallée, Florestan Ogheard and Elsa Batista; Visualization, Thomas Schrøder Daugbjerg and Alexandra Delvallée; Supervision, Florestan Ogheard and Elsa Batista; Project Administration, Thomas Schrøder Daugbjerg, Florestan Ogheard and Elsa Batista; Funding Acquisition, Elsa Batista.
References
- N. Convery, N. Gadegaard, 30 years of microfluidics, Micro Nano Eng. 2, 76–91 (2019) [CrossRef] [Google Scholar]
- D. Qin, Y. Xia, J.A. Rogers, R.J. Jackman, X.-M. Zhao, G.M. Whitesides, Microfabrication, microstructures and microsystems, in Microsystem Technology in Chemistry and Life Science, edited by A. Manz and H. Becker (Springer Berlin Heidelberg, Berlin, Heidelberg, 1998), pp. 1–20 [Google Scholar]
- R.G. Sweet, High frequency recording with electrostatically deflected ink jets, Rev. Sci. Instru. 36, 131 (1965) [CrossRef] [Google Scholar]
- E. Bassous, H.H. Taub, L. Kuhn, Ink jet printing nozzle arrays etched in silicon, Appl. Phys. Lett. 31, 135 (1977) [CrossRef] [Google Scholar]
- S.C. Terry, J.H. Jerman, J.B. Angell, A gas chromatographic air analyzer fabricated on a silicon wafer, IEEE Trans. Electron Dev. 26, 1880 (1979) [CrossRef] [Google Scholar]
- P. Simpson, D. Roach, A. Woolley, T. Thorsen, R. Johnston, G. Sensabaugh, R. Mathies, High-throughput genetic analysis using microfabricated 96-sample capillary array electrophoresis microplates, Proc. Natl. Acad. Sci. USA 95, 2256 (1998) [Google Scholar]
- A.T. Woolley, R.A. Mathies, Ultra-high-speed DNA fragment separations using microfabricated capillary array electrophoresis chips, Proc. Natl. Acad. Sci. USA 91, 11348 (1994) [CrossRef] [PubMed] [Google Scholar]
- H. Kambara, Development of capillary array DNA sequencers for genome analysis, Chem. Record 10, 8 (2010) [CrossRef] [PubMed] [Google Scholar]
- Q. Xiong, J. Cheng, Chapter 2 Chip Capillary Electrophoresis and Total Genetic Analysis Systems, in Perspectives in Bioanalysis, edited by Keith R. Mitchelson, Publisher Elsevier Vol. 2 (2007), pp. 45–95 [CrossRef] [Google Scholar]
- X. Hou, Y.S. Zhang, G.T. Santiago, M.M. Alvarez, J. Ribas, S.J. Jonas, P.S. Weiss, A.M. Andrews, J. Aizenberg, A. Khademhosseini, Interplay between materials and microfluidics, Nat. Rev. Mater. 2, 17016 (2017) [CrossRef] [Google Scholar]
- C.-W. Tsao, Polymer microfluidics: simple, low-cost fabrication process bridging academic lab research to commercialized production, Micromachines 7, 225 (2016) [CrossRef] [PubMed] [Google Scholar]
- T. Tang, Y. Yuan, Y. Yalikun, Y. Hosokawa, M. Li, Y. Tanaka, Glass based micro total analysis systems: materials, fabrication methods, and applications, Sens. Actuat. B 339, 129859 (2021) [CrossRef] [Google Scholar]
- ISO 19403-1:2022 Paints and Varnishes — Wettability — Part 1: Terminology and General Principle (2022) [Google Scholar]
- A. Venkateshwarlu, R.P. Bharti, Effects of surface wettability and flow rates on the interface evolution and droplet pinch-off mechanism in the cross-flow microfluidic systems, Chem. Eng. Sci. 267, 118279 (2023) [CrossRef] [Google Scholar]
- B. Zhao, C. MacMinn, R. Juanes, Wettability control on multiphase flow in patterned microfluidics, Proc. Natl. Acad. Sci. USA 113, 10251–10256 (2016) [CrossRef] [PubMed] [Google Scholar]
- S. Saxena, R. Joshi, Microfluidic devices: applications and role of surface wettability in its fabrication, in Surface Science, edited by Phuong Pham, Pratibha Goel, Samir Kumar, and Kavita Yadav, Publisher IntechOpen (2020) [Google Scholar]
- H. Bruus, Theoretical Microfluidics (Oxford University Press, 2008) [Google Scholar]
- X. Li, X. Chen, Y. Huang, X. Zhang, Effect of interface wettability on the flow characteristics of liquid in smooth microchannels, Acta Mech. 230, 2111–2123 (2019) [CrossRef] [Google Scholar]
- L. Zhigang, G. Ning, Z. Chengwu, Z. Xiaobao, Experimental study on flow and heat transfer in a 19.6-Μm microtube, Exp. Heat Transfer 22, 178 (2009) [CrossRef] [Google Scholar]
- F. Wang, X. Yue, S. Xu, L. Zhang, R. Zhao, J. Hou, Influence of wettability on flow characteristics of water through microtubes and cores, Chin. Sci. Bull. 54, 2256 (2009) [CrossRef] [Google Scholar]
- ISO 25178-2:2021 Geometrical Product Specifications (GPS) Surface Texture: Areal Part 2: Terms, Definitions and Surface Texture Parameters (2021) [Google Scholar]
- ISO 21920-2:2021 Geometrical Product Specifications (GPS) Surface Texture: Profile Part 2: Terms, Definitions and Surface Texture Parameters (2021) [Google Scholar]
- Y.-M. Kim, W.-S. Kim, S.-H. Lee, J.-Y. Baek, Effects of surface roughness on the flow characteristics in PDMS microchannels, in 2005 3rd IEEE/EMBS Special Topic Conference on Microtechnology in Medicine and Biology, Vol. 2005 (2005), pp. 292–295 [CrossRef] [Google Scholar]
- X. Yuan, Z. Tao, H. Li, Y. Tian, Experimental investigation of surface roughness effects on flow behavior and heat transfer characteristics for circular microchannels, Chin. J. Aeronaut. 29, 1575 (2016) [CrossRef] [Google Scholar]
- P. Ranjan, Investigations on the flow behaviour in microfluidic device due to surface roughness: a computational fluid dynamics simulation, Microsyst. Technolog. 25, 3779–3789 (2019) [CrossRef] [Google Scholar]
- V. Silverio, S. Guha, A. Keiser, R. Natu, D. Reyes, H. Heeren, N. Verplanck, L. Herbertson, Overcoming technological barriers in microfluidics: leakage testing, Front. Bioeng. Biotechnol. 10, 958582 (2022) [CrossRef] [Google Scholar]
- T. Wang, J. Wu, T. Chen, F. Li, T. Zuo, S. Liu, Surface roughness analysis and thermal bonding of microfluidic chips fabricated by CD/DVD manufacturing technology, Microsyst. Technolog. 23, (2017) [Google Scholar]
- E. Batista, V. Silverio, F. Ogheard, C. Pecnik, H. Becker, A. Niemann, MFMET project − establishing metrology standards in microfluidic devices, in Conference: 19th International Flow Measurement Conference 2022 (2023) [Google Scholar]
- E. Batista, J. Sousa, F. Saraiva, A. Lopes, V. Silverio, R. Martins, L. Martins, The importance of dimensional traceability in microfluidic systems, Metrology 4, 240 (2024) [CrossRef] [Google Scholar]
- L. Crouzier, C. Pecnik, MFMET A3. 2.4: Test Protocol for Surface Roughness (2022) [Google Scholar]
- C. Pecnik, L. Crouzier, F. Saraiva, E. Batista, P. Neves, V. Silverio, MFMET A3. 2.7 Documented Example of Surface Roughness Measurements (2023) [Google Scholar]
- C. Pecnik et al., MFMET Deliverable 5 − Guidelines for the Measurement of Key Performance Parameters of Microfluidic Connections Including the Identification of Key Properties in an Interface (2024) [Google Scholar]
- F. Ogheard, MFMET A3. 2.5. Documented Example of Wettability Test Protocol (2024) [Google Scholar]
- K. Romieu, A. Dalvallée, MFMET Webinar − 03. Wettability and Surface Roughness (2024) [Google Scholar]
- C. Pecnik, L. Crouzier, F. Saraiva, E. Batista, P. Neves, V. Silverio, MFMET A3. 2.7 Documented Example of Surface Roughness Measurements [Data Set], (2024) [Google Scholar]
- ISO 19403-2:2024 Paints and Varnishes — Wettability — Part 2: Determination of the Surface Free Energy of Solid Surfaces by Measuring the Contact Angle (2024) [Google Scholar]
- M. Heshmati, M. Piri, Experimental investigation of dynamic contact angle and capillary rise in tubes with circular and noncircular cross sections, Langmuir 30, 14151 (2014) [Google Scholar]
- S. Ehlers, J. Könemann, O. Ott, H. Wolf, J. Šetina, A. Furtado, W. Sabuga, Selection and characterization of liquids for a low pressure interferometric liquid column manometer, Measurement 132, 191 (2019) [Google Scholar]
- A.O. Olanrewaju, M. Beaugrand, M. Yafia, D. Juncker, Capillary microfluidics in microchannels: from microfluidic networks to capillaric circuits, Lab Chip 18, 2323 (2018) [CrossRef] [PubMed] [Google Scholar]
- S. Son, L. Chen, Q. Kang, D. Derome, J. Carmeliet, Contact angle effects on pore and corner arc menisci in polygonal capillary tubes studied with the pseudopotential multiphase lattice boltzmann model, Computation 4, 12 (2016) [CrossRef] [Google Scholar]
- V. Heiskanen, K. Marjanen, P. Kallio, Machine vision based measurement of dynamic contact angles in microchannel flows, J. Bionic Eng. 5, 282 (2008) [CrossRef] [Google Scholar]
- M. Jafari, J. Jung, Direct measurement of static and dynamic contact angles using a random micromodel considering geological CO2 sequestration, Sustainability 9, 2352 (2017) [CrossRef] [Google Scholar]
- KRÜSS, Calibration Standards CP24, https://www.kruss-scientific.com/en/products-services/accessories/cp24 [Google Scholar]
- ImageJ Image Processing and Analysis in Java, https://imagej.net/ij/index.html [Google Scholar]
- D.K. Owens, R.C. Wendt, Estimation of the surface free energy of polymers, J. Appl. Polym. Sci. 13, 1741 (1969) [CrossRef] [Google Scholar]
- D.H. Kaelble, Dispersion-polar surface tension properties of organic solids, J. Adhesion 2, 66 (1970) [CrossRef] [Google Scholar]
- ISO 19403-2:2017 Paints and Varnishes — Wettability — Part 2: Determination of the Surface Free Energy of Solid Surfaces by Measuring the Contact Angle (2017) [Google Scholar]
- ANSI, DIN EN 10049:2014 Measurement Of Roughness Average Ra And Peak Count RPc On Metallic Flat Products (2014) [Google Scholar]
- N. Jalili, K. Laxminarayana, A review of atomic force microscopy imaging systems: application to molecular metrology and biological sciences, Mechatronics 14, 907 (2004) [CrossRef] [Google Scholar]
- R. Garcı́a, R. Pérez, Dynamic atomic force microscopy methods, Surf. Sci. Rep. 47, 197 (2002) [CrossRef] [Google Scholar]
- F. Marinello, Atomic force microscopy, in CIRP Encyclopedia of Production Engineering (Springer, 2014), pp. 62–66. [CrossRef] [Google Scholar]
- Veeco, Veeco Dimension 3100 Manual (2004) [Google Scholar]
- BRUKER, OLTESPA-R3, https://www.brukerafmprobes.com/p-3865-oltespa-r3.aspx [Google Scholar]
- L. Crouzier, A. Delvallee, S. Ducourtieux, L. Devoille, G. Noircler, C. Ulysse, O. Tache, E. Barruet, C. Tromas, N. Feltin, Development of a new hybrid approach combining AFM and SEM for the nanoparticle dimensional metrology, Beilstein J. Nanotechnol. 10, 1523 (2019) [CrossRef] [Google Scholar]
- Digital Surf, What's inside MountainsLab® (n.d.) [Google Scholar]
- ISO 25178-6:2010 Geometrical Product Specifications (GPS) Surface Texture: Areal Part 6: Classification of Methods for Measuring Surface Texture (2010) [Google Scholar]
- ISO 25178-602:2010 Geometrical Product Specifications (GPS) Surface Texture: Areal Part 602: Nominal Characteristics of Non-Contact (Confocal Chromatic Probe) Instruments (2010) [Google Scholar]
- A. Mínguez Martínez, P. Maresca, J. Caja, J. de Vicente y Oliva, Results of a surface roughness comparison between stylus instruments and confocal microscopes, Materials 15, 5495 (2022) [Google Scholar]
- T. Vorburger, H.-G. Rhee, T. Renegar, J.-F. Song, X. Zheng, Comparison of optical and stylus methods for measurement of surface texture, Int. J. Adv. Manufactur. Technol. 33, 110 (2007) [CrossRef] [Google Scholar]
- R. Leach, The Measurement of Surface Texture Using Stylus Instruments (2001) [Google Scholar]
- Mahr, MarSurf The Newest Generation of Tactile Measuring Technology (2019) [Google Scholar]
- ISO 21920-3:2021 Geometrical Product Specifications (GPS) − Surface Texture: Profile − Part 3: Sepcification Operators (2021) [Google Scholar]
- JCGM, JCGM 100:2008 GUM 1995 with Minor Corrections Evaluation of Measurement Data — Guide to the Expression of Uncertainty in Measurement (2008) [Google Scholar]
- D. Freedman, R. Pisani, R. Purves, Statistics, 4th edition (W.W. Norton & Company, 2007) [Google Scholar]
- M. Newville, T. Stensitzki, R. Otten et al., LMFIT, https://lmfit.github.io/lmfit-py/ [Google Scholar]
- R. Borah, A. Kumar, M. Das, A. Ramteke, Surface functionalization-induced enhancement in surface properties and biocompatibility of polyaniline nanofibers, RSC Adv. 5, 48971–48982 (2015) [CrossRef] [Google Scholar]
- Y. He, I. Dobryden, J. Pan, A. Ahniyaz, T. Deltin, R. Corkery, P. Claesson, Nano-scale mechanical and wear properties of a waterborne hydroxyacrylic-melamine anti-corrosion coating, Appl. Surf. Sci. 457, 548–558 (2018) [CrossRef] [Google Scholar]
- G. Ström, M. Fredriksson, P. Stenius, Contact angles, work of adhesion, and interfacial tensions at a dissolving hydrocarbon surface, J. Colloid Interface Sci. 119, 352 (1987) [CrossRef] [Google Scholar]
- R.N. Wenzel, Resistance of solid surfaces to wetting by water, Ind. Eng. Chem. 28, 988 (1936) [CrossRef] [Google Scholar]
- R.N. Wenzel, Surface roughness and contact angle, J. Phys. Colloid Chem. 53, 1466 (1949) [CrossRef] [Google Scholar]
- A.B.D. Cassie, S. Baxter, Wettability of porous surfaces, Trans. Faraday Soc. 40, 546 (1944) [CrossRef] [Google Scholar]
- A. Hongru, L. Xiangqin, S. Shuyan, Z. Ying, L. Tianqing, Measurement of wenzel roughness factor by laser scanning confocal microscopy, RSC Adv. 7, 7052 (n.d.) [Google Scholar]
Cite this article as: Thomas Schrøder Daugbjerg, Loïc Crouzier, Alexandra Delvallée, Florestan Ogheard, Christina Pecnik, Kevin Romieu, Fernanda Saraiva, Elsa Batista, Measurement of wettability and surface roughness for metrology and quality control in microfluidics, Int. J. Metrol. Qual. Eng. 16, 2 (2025), https://doi.org/10.1051/ijmqe/2024021
All Tables
Values of x and y. The uncertainties Uy are stated with a 95 % confidence level (k = 2). These results were also communicated in reports of the MFMET project [32,33]. Also shown are values, yfit, from the fit in Figure 5 and a comparison of y and yfit with Z-score [64] using uy = Uy/2. The discussion has further details on the Z-score comparison.
Results of surface roughness measurements by AFM and stylus profilometry. The samples and locations of measurements are shown in Figure 1. The uncertainties have a 95 % confidence level (k = 2). No AFM results were available from the channel surfaces of sample 4, or from sample 5. No stylus profilometry results were available from the bonding surface of sample 2 − sample 4. These results were also communicated in reports and a data set of the MFMET project [31,32,34,35].
All Figures
|
Fig. 1 Selected glass slides from Table 1, and locations of surface roughness measurements. The open channels in sample 2–sample 4 are 100 μm deep and 9.5 mm wide. Sample 1 is not shown in this figure, because it was used for wettability measurements only. A) Sample 2–sample 4 had measurements with atomic force microscopy made at the indicated locations. B) Sample 2–sample 4 had stylus instrument measurements made at the indicated locations. C) Sample 5 had stylus instrument measurements made at the indicated locations. |
| In the text | |
|
Fig. 2 Illustration of a liquid drop resting on a solid surface. In the three-phase point the solid, liquid, and atmosphere (containing vapour) are in contact. Also shown in the illustration are the contact angle θ, the surface tension of the liquid is σl, and the surface free energy of the solid surface σs. Source: Redrawn from ISO 19403-1 [13]. |
| In the text | |
|
Fig. 3 The laboratory setup at CETIAT in Villeurbanne, France, for measuring contact angles on a flat surface. A − white diffused lighting, B − slide under test, C − slide holder, D − high resolution microscope camera. Image credit: CETIAT. |
| In the text | |
|
Fig. 4 The MarSurf GD 140 stylus instrument at IPQ, Caparica, Portugal, during the measurement of surface roughness parameters of a sample. Image credit: IPQ. |
| In the text | |
|
Fig. 5 Plot of values of x and y. Uncertainties of y, b and m have a 95 % confidence level (k=2). A linear equation with confidence band was fitted using LMFIT [65], and the fit parameters are: intercept b = (6 ± 3) (mN/m)1/2 and slope m = (5 ± 4) (mN/m)1/2. The R-squared of the fit is R2=0.87. These results were also communicated in reports of the MFMET project [32–34]. |
| In the text | |
|
Fig. 6 Topographic surfaces of selected measurements with AFM. Samples and surface types can be compared with Table 1 and Figure 1. For each pair of sample and surface, three AFM measurements contributed to the AFM averages presented in Table 6. These results were also communicated in reports of the MFMET project [31,34]. |
| In the text | |
Current usage metrics show cumulative count of Article Views (full-text article views including HTML views, PDF and ePub downloads, according to the available data) and Abstracts Views on Vision4Press platform.
Data correspond to usage on the plateform after 2015. The current usage metrics is available 48-96 hours after online publication and is updated daily on week days.
Initial download of the metrics may take a while.