Fig. 3
Download original image
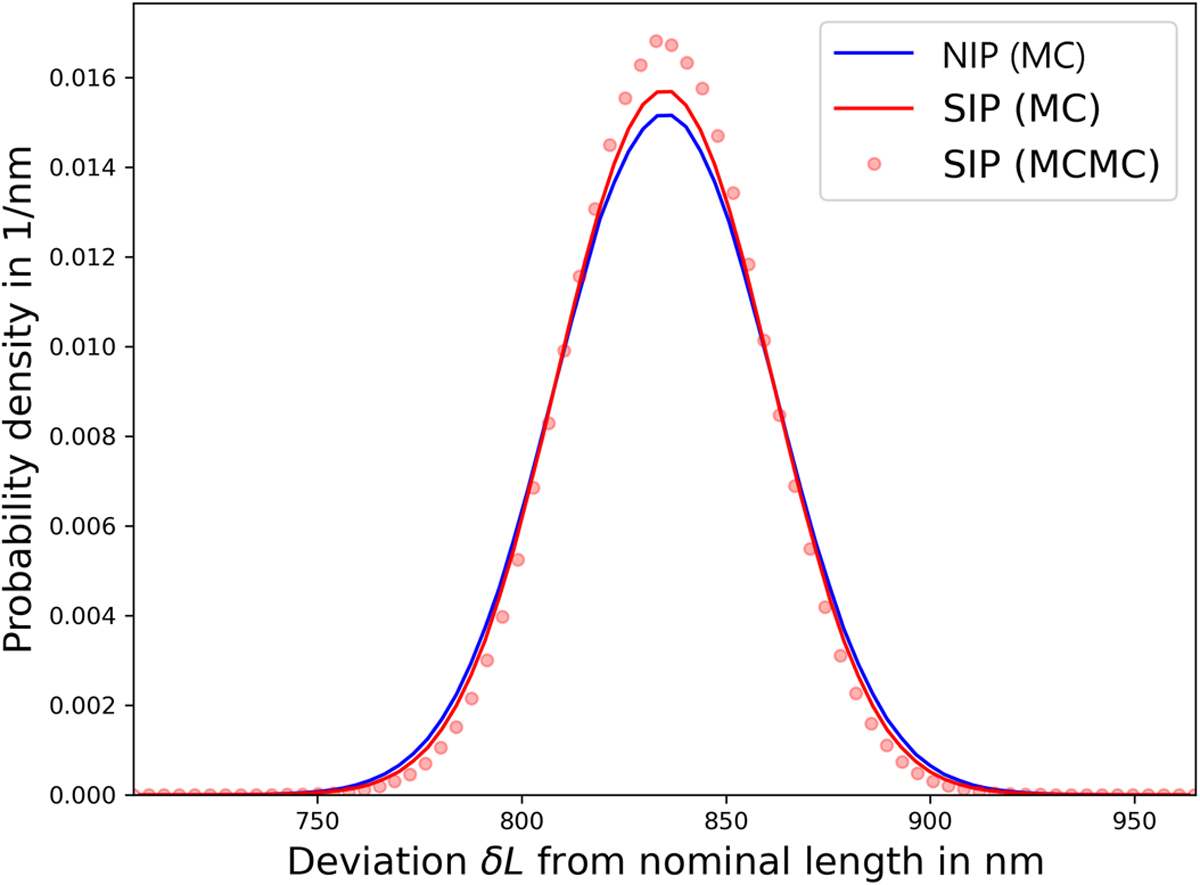
Results for the lognormal example of Section 3.2. We show the state of knowledge distributions for the measurand δL. The resulting PDF using the noninformative prior (NIP) is shown as a solid blue line and the informative prior (SIP (MC)) as a solid red line. The PDF resulting from the conventional Bayesian approach (SIP (MCMC)) using a vague measurand prior is shown by the dotted red line.
Current usage metrics show cumulative count of Article Views (full-text article views including HTML views, PDF and ePub downloads, according to the available data) and Abstracts Views on Vision4Press platform.
Data correspond to usage on the plateform after 2015. The current usage metrics is available 48-96 hours after online publication and is updated daily on week days.
Initial download of the metrics may take a while.