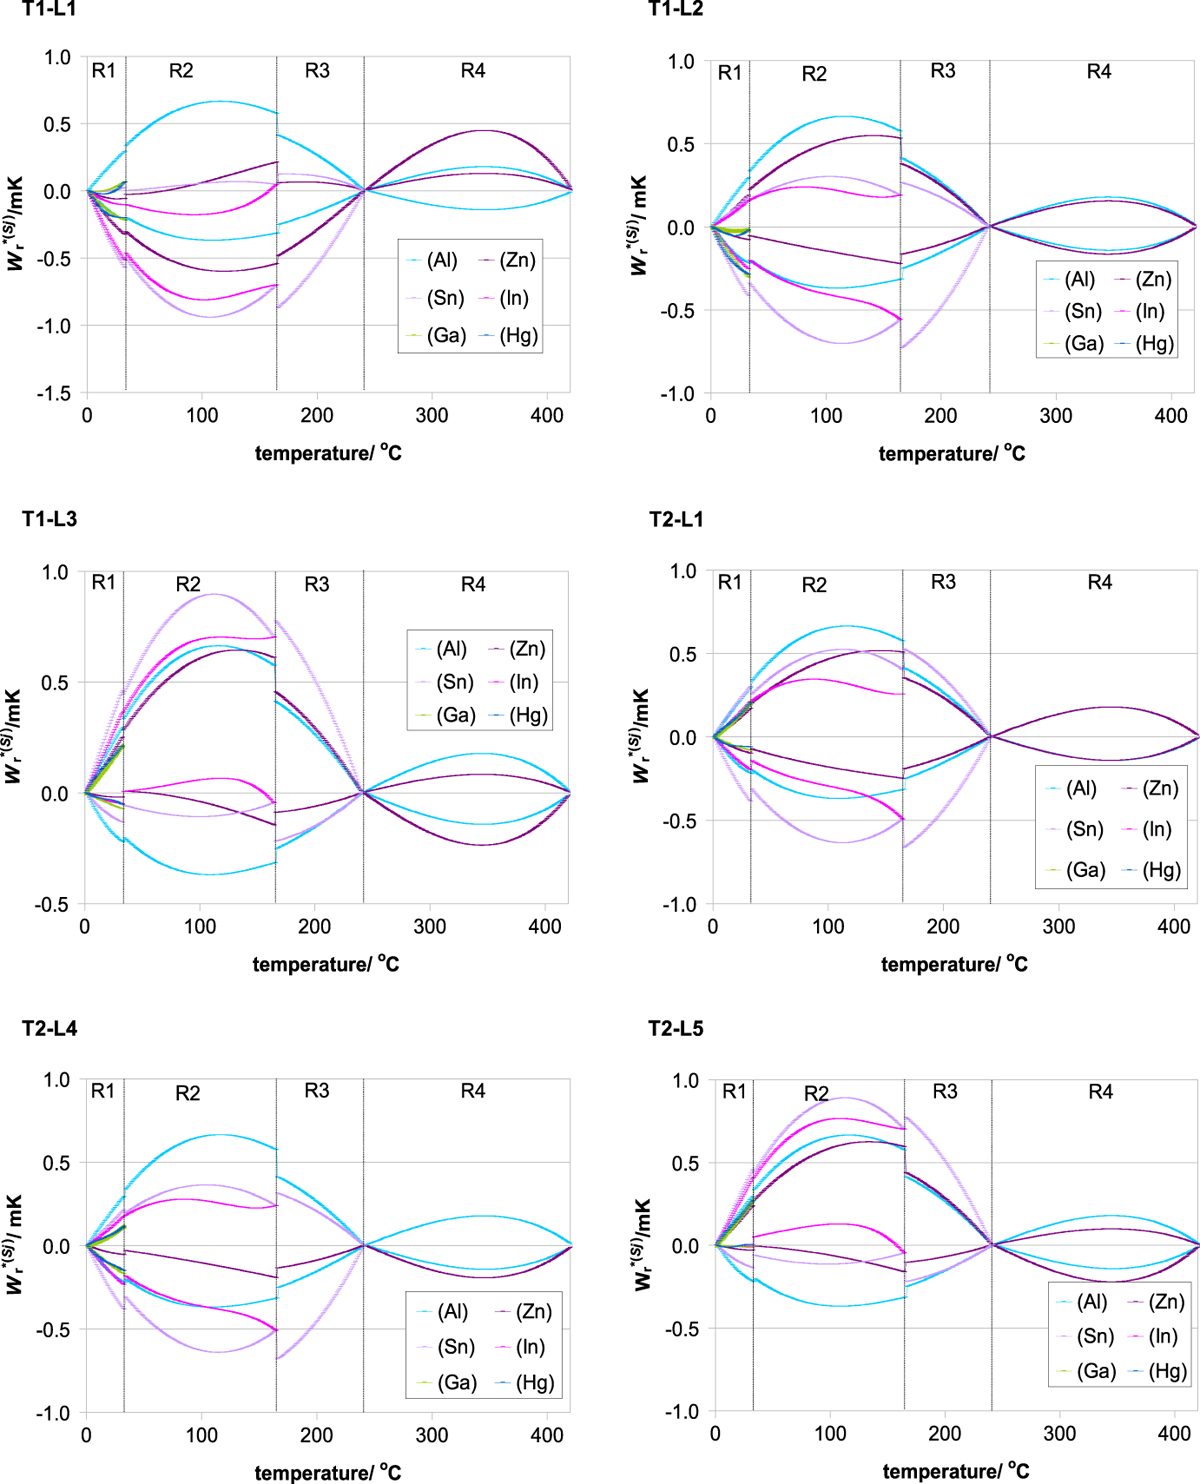
Fig. B.2


Download original image Download original image
We have graphically verified the consistency of the corrected results obtained in the different subranges that overlap. The values of ![]() in each subrange (Sj) are several orders of magnitude higher than the values of the applied corrections. For this reason, before drawing the diagrams, we resorted to shifting each value
in each subrange (Sj) are several orders of magnitude higher than the values of the applied corrections. For this reason, before drawing the diagrams, we resorted to shifting each value ![]() by the same quantity, namely
by the same quantity, namely ![]() , an adjustment that does not affect the validity of the test. The corrected (and adjusted) result
, an adjustment that does not affect the validity of the test. The corrected (and adjusted) result ![]() then becomes
then becomes ![]() , where the difference
, where the difference ![]() is considered to be a number without uncertainty,
is considered to be a number without uncertainty, ![]() is the sample mean, U is the extended uncertainty, U = k
is the sample mean, U is the extended uncertainty, U = k ![]() , which defines an interval having a level of confidence of approximately 95% for a normal distribution, with the standard uncertainty
, which defines an interval having a level of confidence of approximately 95% for a normal distribution, with the standard uncertainty ![]() =
=![]() and k = 2. The graphics created for the corrected results
and k = 2. The graphics created for the corrected results ![]() vs temperature demonstrate that the intervals of uncertainty overlap in all cases. By consequence, we can claim that the results obtained after the correction in the different subranges that overlap are consistent (they agree) within their uncertainties (calculated for a level of confidence of 95 %) [31,32]. The vertical lines on each chart mark the regions of temperature, with 6, 4, 3 and, respectively, 2 overlapping subranges (Ri, i = 1, 2, 3, 4). L − participating laboratory; T − calibrated thermometer.
vs temperature demonstrate that the intervals of uncertainty overlap in all cases. By consequence, we can claim that the results obtained after the correction in the different subranges that overlap are consistent (they agree) within their uncertainties (calculated for a level of confidence of 95 %) [31,32]. The vertical lines on each chart mark the regions of temperature, with 6, 4, 3 and, respectively, 2 overlapping subranges (Ri, i = 1, 2, 3, 4). L − participating laboratory; T − calibrated thermometer.
Current usage metrics show cumulative count of Article Views (full-text article views including HTML views, PDF and ePub downloads, according to the available data) and Abstracts Views on Vision4Press platform.
Data correspond to usage on the plateform after 2015. The current usage metrics is available 48-96 hours after online publication and is updated daily on week days.
Initial download of the metrics may take a while.


