Fig. 4
Download original image
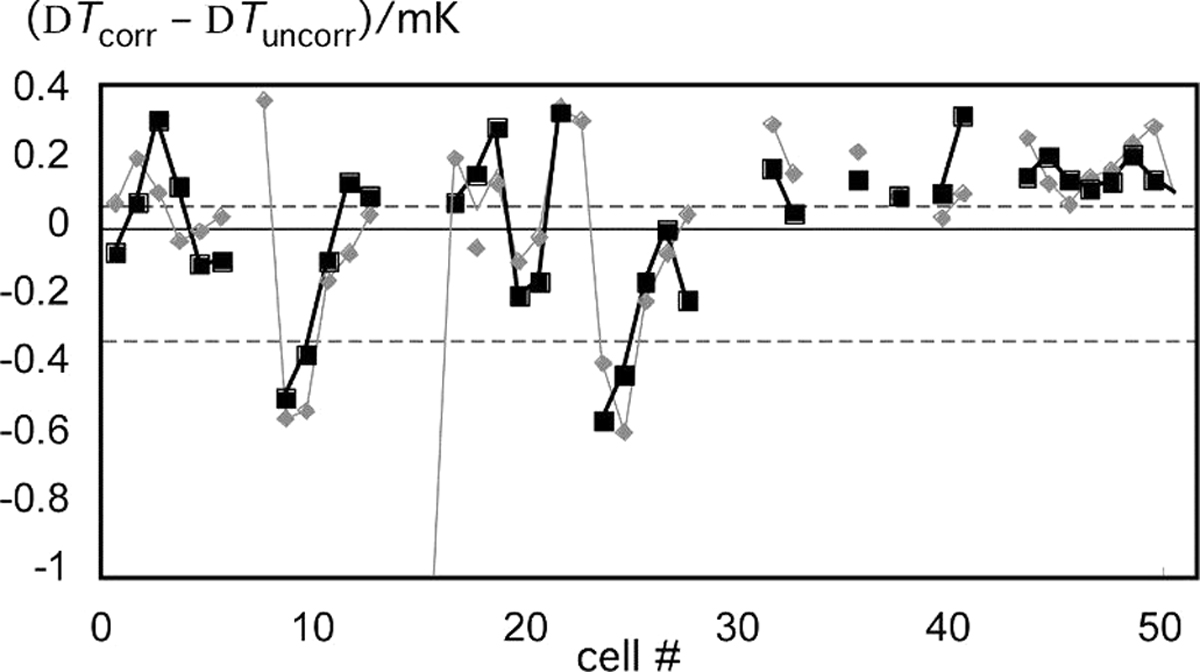
Graphical representation of differences from the KCRV of K2-xx and Star direct-cell Inter-comparison, uncorrected (gray dots and lines) and corrected (black squares and lines): (T – KCRVK2ac) = DTthermal,ac (Tab. 2); (T – KCRVK2bc) = ΔToriginal (Fig. 1). On the left until #28: K2-xx differences for cells #1 to #15 and thermometer sets #1 and #2. ΔToriginal,#1 = –147(268) µK, ΔToriginal,#2 = –166(309) µK; DTthermal,ac,#1 = –167(233) µK, DTthermal,ac,#2 = –147(240) µK. On the right from #30 to end: Star differences (56(68) µK; 74(87) µK before isotopic correction), u = 47 µK [12]⋅ The dotted lines indicate the range of the isotopic effect for the studied samples, as obtained from the MeP [31] in Table 3.
Current usage metrics show cumulative count of Article Views (full-text article views including HTML views, PDF and ePub downloads, according to the available data) and Abstracts Views on Vision4Press platform.
Data correspond to usage on the plateform after 2015. The current usage metrics is available 48-96 hours after online publication and is updated daily on week days.
Initial download of the metrics may take a while.