| Issue |
Int. J. Metrol. Qual. Eng.
Volume 8, 2017
|
|
|---|---|---|
| Article Number | 5 | |
| Number of page(s) | 6 | |
| DOI | https://doi.org/10.1051/ijmqe/2017003 | |
| Published online | 20 February 2017 | |
Research Article
Graphite nanobelts characterization and application for blood pulse sensing★
1
Center for Semiconductor Components and Nanotechnology, State University of Campinas,
Campinas
13083-870,
SP, Brazil
2
Lobachevsky State University of Nizhni Novgorod,
Nizhny Novgorod
603950, Russia
3
Center for Information Technology Renato Archer,
Campinas
13069-901,
SP, Brazil
⁎ Corresponding author: This email address is being protected from spambots. You need JavaScript enabled to view it.
Received:
28
October
2016
Accepted:
25
January
2017
Abstract
In this work, graphite nanobelts-based films as a promising material for applications in flexible blood pulse sensors with low power consumption are studied. A modified Langmuir Blodgett method used here for the sensor fabrication, is a reliable, simple and scalable technique allowing for controlled deposition of conducting films with desired electrical properties. The nanobelts, deposited over oxidized silicon or onto flexible polydimethylsiloxane substrates, were morphologically and electrically characterized. The response of the sensors to blood pulses measured on wrists and necks of two different persons (a male and a female) and the ways of the sensor response optimization are discussed.
Key words: Graphene / Graphite / Nanobelts / Blood pressure sensor
This journal article is written on the basis of the research results presented during the European Graphene Forum 2016 that was held from 1st to 3rd June 2016 in Paris, France.
© A.V. Alaferdov et al., published by EDP Sciences, 2017
 This is an Open Access article distributed under the terms of the Creative Commons Attribution License (http://creativecommons.org/licenses/by/4.0), which permits unrestricted use, distribution, and reproduction in any medium, provided the original work is properly cited.
1 Introduction
The need for flexible, skin-friendly wearable electronics has attracted much interest in the last decade, with numerous possible applications that span from simple recreational exercise monitoring to rare heart disease diagnostics and soft robotics [1–3]. Integration of sensing materials with flexible substrates and elements for signal detection and processing is highly required and involves multidisciplinary researches [1–8].
One of the most suitable materials for wearable electronics is graphene in different forms (from a single to multiple layers) which has excellent mechanical properties and high electrical conductivity [5,8,9]. Among different forms of graphene based materials, nanographite structures that can have lateral size up to tens of microns and thickness from a few to tens of nanometers currently attracts increasing attention [9]. Low fabrication costs, easy procedures for manipulation and transfer onto different types of substrates make this material promising for flexible electronics [10,11]. Graphene or nanographite-based devices, using fibers [2], layered [8] or network [12,13] graphitic materials showed high sensitivity and reproducibility for strain, pressure and blood pulse sensing.
Pressure and shear forces detection for grasp control and strain recognition for proprioception are some of the important parameters to be measured for epidermal flexible devices [1]. The routes used for transducing the tactile senses into electrical signals are mainly based on piezoresistivity [12–17] and piezoelectricity [18–20] phenomena. The basic requirements for commercial wearable sensors include high sensitivity, selectivity to different type of stimuli, stability, durability, low cost and weight, reduced power consumption, scalability, simplicity of fabrication and low environmental impact.
Among the e-skin applications, heartbeat and blood pulse sensors represent one of the most studied devices due to the increasing need for heart and circulatory system monitoring [16–21]. Carbon [2] and polymeric nanofibers [4], carbon nanotubes decorated with quantum dots [14], polymer micropillars [4], semiconducting oxide nanostructures [17], graphene networks [12,13] and ultra-thin silicon chips [16] are some of the materials and morphologies used for heartbeat sensors.
In this work, we present graphite nanobelts (GNBs) as promising material for applications in flexible blood pulse sensors with low power consumption. A modified Langmuir Blodgett method, used here for the sensor fabrication, is a reliable, simple and scalable technique allowing for controlled deposition of conducting films with desired electrical properties. The nanobelts, deposited over oxidized silicon or onto flexible polydimethylsiloxane (PDMS) substrates, were morphologically and electrically characterized. The response of the sensors to blood pulses measured on wrists and necks of two different persons (a male and a female) and the ways of the sensor response optimization are discussed.
2 Experimental procedure
The GNBs used are produced from natural graphite by liquid phase chemically assisted exfoliation by Nacional de Grafite Ltd, Brazil [22]. The nanobelts are characterized by an extremely high aspect ratio (length/thickness) and have the following dimensions: length in the range from 10 to 50 µm, width from 1 to 5 µm and thickness from 5 to 50 nm.
For deposition of thin films based on GNBs onto different substrates, the nanobelts were first suspended in N-Methyl-2-pyrrolidone (Sigma Aldrich) solutions using an ultrasonic bath (Unique USC-1880, 100 W, 37 kHz) and then deposited using a modified Langmuir–Blodgett (LB) method with a special trapezoidal cuvette [11,23]. For detailed electrical characterization of GNBs based films, depositions were done over thermally oxidized Si substrates (SiO2 thickness of ∼300 nm) with an active area of 7 × 7 mm2. Electrical contacts for four point measurements using Van der Pauw geometry were fabricated on the samplés corners using silver paste (Ted Pella) and gold wires (50 μm diameter).
For exploring electrical properties of single nanobelts, the same LB method was used for deposition of separate nanobelts from strongly diluted suspensions over thermally oxidized Si-substrates (SiO2 ∼300 nm thick). Subsequently, 200 nm thick Ti/Au (30/170 nm) metal electrodes were fabricated by a lift-off process using electron beam lithography (eLine Plus, Raith, USA) and a custom-built sputtering system equipped with three radio-frequency (RF) guns for 2-in. diameter targets.
For fabrication of GNBs-based flexible sensors, commercial elastomeric PDMS sheets, having a thickness of 250 µm, were used (Bisco® HT-6240, Rogers Corp.). Before deposition of films, surface functionalization using a low-density capacitively coupled RF discharge plasma (oxygen flow of 10 sccm, gas pressure of 50 mTorr, RF power of 300 W and processing time of 10 min) was carried out to make the PDMS surface hydrophilic. The volume of suspensions used for LB film depositions (Fig. 1a) was usually in the range of a few (1–5) µL and higher density GNBs films were obtained through sequential LB depositions of GNBs layers over the same substrate. Depending on the initial concentration of the suspension, different densities of GNB films were produced, resulting in a significant variation of the film optical transparency (from semitransparent to almost opaque) and conductivity. Finally, metallic Ti (30 nm)/Au (200 nm) electrodes were deposited by sputtering at two opposite edges of the GNB films.
Scanning electron microscopy (SEM, Nova 200 Nanolab, FEI) and optical microscopy (Olympus MX51) were used to characterize the nanobelt-based films. Micro-Raman spectroscopy in a confocal configuration and atomic force microscopy (Raman/AFM, NT-MDT NTEGRA Spectra, with a 473 nm laser) were also used for characterization of individual GNBs.
The resistivity measurements for both individual nanobelts and thin films were performed using aPPMS-14 system (Quantum Design, Inc.) in the temperature range from 3 to 300 K.
The experiments for blood pulse sensing were performed using samples with an area of 2.5 × 1.5 cm2. Note that the method allows fabrication of larger samples (if required) by increasing the size of the LB deposition cuvette. In order to measure and characterize the response of the fabricated sensors, electrical measurements were performed, in ambient conditions, using a 2636A Keithley source-meter with the operating voltage varying from 0.1 to 5 V. For blood pulse testing (Fig. 1b), the sensors were first fixed on a medical belt (Fig. 1c) and then onto the neck (Fig. 1d) or onto the wrist by commercial pressure measurement cuff with an air injection system and a sphygmomanometer. After fixation, the sensor was connected to the source-meter for measurements.
 |
Fig. 1 Schematic drawing showing: (a) the set-up used for the nanobelt films deposition and (b) the configuration used for sensor testing with the PDMS covered sensor (1) fixed on a medical belt and connected to a source-meter (2) for electrical measurements; photographs showing the sensor attached to the belt (c) and fixed on a men's neck for electrical measurements (d). |
3 Results and discussion
Raman spectroscopy and AFM measurements were performed in order to characterize the quality of individual nanobelts, as shown in Figure 2. Typical Raman lines for graphitic materials were observed: D (∼1365 cm−1), G (∼1580 cm−1) and 2D (∼2725 cm−1). A low D/G line intensity ratio (ID/IG ≈ 0.07) (Fig. 2a) and small width low of G-line (FWHM ∼18 cm−1) indicate a low density of defects in nanobelts [24]. The AFM measurements show highly uniform and high aspect ratio nanostructures (Fig. 2b), with their thicknesses usually being in the range of 30 ± 20 nm (Fig. 2c).
Figure 3 shows SEM images of the electrodes configuration used for electrical characterization of single graphite nanobelts.
Resistivity measurements performed on single nanobelts at different temperatures showed a semiconductor-like behavior (Fig. 4a). This behavior is a typical behavior of ρ(T)-dependence for graphitic materials with micron-scale lateral sizes and nano-scale thickness [25–27]. This means that, in a high-temperature regime, the sample resistance is determined by carriers scattering on phonons. With decreasing temperature, the carrier density decreases and thus, resistance increases. For temperatures lower that ∼60 K, the resistance has almost no dependence of temperature (Fig. 4a) and is basically determined by carrier scattering on structural defects in a nanobelt.
Resistivity measurements were also performed for ultrathin nanobelts films for varying temperatures, as shown in Figure 4b. These films also present semiconductor-like behavior, but the region where resistance is determined by carrier scattering on structural defects is not observed. This is due to the fact that in this case the film resistance is determined basically by the contact resistances between nanobelts. As temperature decreases, the contact resistance between nanobelts and thus the total sample resistance increase (Fig. 4b).
Thicker GNBs films were fabricated for testing in flexible blood pulse sensors. Figure 5 presents typical optical (Fig. 5a) and SEM (Fig. 5b) images of films formed by GNBs deposited over PDMS flexible substrates by the LB technique. As can be observed, the film is quite uniform (Fig. 5a) and its composed of randomly oriented percolated GNBs (Fig. 5b). As the PDMS surface is rough, nanobelts do not cover completely its surface, leaving some areas uncovered and thus transparent (Fig. 5b).
Previous results obtained with this sensor configuration [23] demonstrated its high sensitivity for bending. Therefore, this sensor can be employed for cardio-respiratory signal monitoring, when attached to the skin surface subject to curvature variation during both blood circulation in arteries and breathing. Generally, the signal shape for this type of sensors is highly complex and requires a special signal processing [21].
Figure 6 presents the normalized current detected by a sensor as function of time during blood pulse monitoring using a simple medical belt, with no pressure applied. The tests were performed with sensors fixed onto the neck and the wrist of a 36-year-old woman and onto the neck of a 28-year-old man and at least 20 peaks of pulses (heartbeat rate near 55–60 Hz) were recorded every time. As can be observed, there is a noticeable difference in signal waveshapes in Figure 6a (man vs woman pulses) whereas quite similar waveshapes were detected for wrist and neck blood pulses for the same person (woman) in Figure 6b.
For improving the sensitivity and repeatability of the sensor response at low voltages, we fixed the sensor directly on the wrist using a commercial pressure measurement cuff. Using the cuff, pressures in the range from 20 to 120 Torr were applied. The electrical responses obtained are presented in Figure 7. As can be seen, the sensitivity first increases with applied pressure likely due to better physical contact between the sensor and the skin, with the best conditions achieved for pressure values of 80–100 Torr. Further increasing of pressure results in a fast drop of sensitivity probably because of too tight sensor/skin contact that can block locally the blood pulsation in the artery. Also it can be noted that at applied pressure of 100 Torr, the best repeatability of the sensor response is observed, with the lowest values of error bars for this pressure which is recommended to achieve higher accuracy in the measurements.
 |
Fig. 2 (a) Typical Raman spectrum of GNBs; (b) AFM image of a single graphite nanobelt deposited over Si/SiO2 and (c) typical cross-section of this nanobelt taken in the region marked with the white line in (b). |
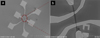 |
Fig. 3 SEM images of the electrodes configuration used for electrical characterization of single graphite nanobelts: low (a) and high (b) magnification SEM images. Patterns with long pointed lines ended with large contact pads were designed to provide accurate electrical measurements. |
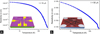 |
Fig. 4 Electrical resistivity as function of temperature for a single nanobelt (a) and ultrathin film (b). The insets show the electrical configuration used for the measurements. |
 |
Fig. 5 Optical (a) and SEM (b) images of the PDMS surface covered by nanobelts deposited by LB technique, film density is higher for the (b) case. |
 |
Fig. 6 Normalized current vs time cycles obtained using a blood pulse sensor fixed by a simple medical belt fixed on: (a) a 28 old man neck and a 36 old woman neck and (b) neck and wrist of a 36 old woman. Operating voltage is of 0.4 V. |
 |
Fig. 7 Sensor sensitivity vs applied pressure for different voltages. |
4 Conclusions
Thin GNBs-based films were deposited over oxidized silicon or flexible PDMS substrates using a modified LB method. This method is reliable, simple and scalable, leading to controlled deposition of nanostructures individually or in a form of thin conductive films. Raman and AFM measurements indicated high quality of nanobelts while the electrical tests show their semiconductor-like behavior. The nanobelt films deposited onto flexible substrates were tested as blood pulse sensors. The tests were performed onto wrist and neck of two different persons (a male and a female) and the preliminary results show high sensitivity of films for monitoring of blood pulse. Further optimization of the sensor sensitivity to blood pulses and respiration is currently in progress.
Acknowledgments
The authors acknowledge financial support from CNPq, FAPESP and INCT NAMITEC (Brazil), and technical assistance of the staff from CCS Nano and IFGW-UNICAMP.
References
- A. Chortos, Z. Bao, Skin-inspired electronic devices, Mater. Today 17, 321 (2014) [CrossRef] [Google Scholar]
- G. Sun, X. Wang, P. Chen, Microfiber devices based on carbon materials, Mater. Today 18, 215 (2015) [CrossRef] [Google Scholar]
- D.-H. Kim, N. Lu, R. Ma, Y.-S. Kim, R.-H. Kim, S. Wang, J. Wu, S.M. Won, H. Tao, A. Islam, K.J. Yu, T. Kim, R. Chowdhury, M. Ying, L. Xu, M. Li, H.-J. Chung, H. Keum, M. McCormick, P. Liu, Y.-W. Zhang, F.G. Omenetto, Y. Huang, T. Coleman, J.A. Rogers, Epidermal electronics, Science 333, 838 (2011) [CrossRef] [PubMed] [Google Scholar]
- H. Park, Y.R. Jeong, J. Yun, S.Y. Hong, S. Jin, S. Lee, G. Zi, J.S. Ha, Stretchable array of highly sensitive pressure sensors consisting of polyaniline nanofibers and Au-coated polydimethylsiloxane micropillars, ACS Nano 9, 9974 (2015) [CrossRef] [PubMed] [Google Scholar]
- M. Amjadi, K.-U. Kyung, I. Park, M. Sitti, Stretchable, skin-mountable, and wearable strain sensors and their potential applications: a review, Adv. Funct. Mater. 26, 1678 (2016) [CrossRef] [Google Scholar]
- N. Luo, W. Dai, C. Li, Z. Zhou, L. Lu, C.C.Y. Poon, S.-C. Chen, Y. Zhang, N. Zhao, Flexible piezoresistive sensor patch enabling ultralow power cuffless blood pressure measurement, Adv. Funct. Mater. 26, 1178 (2016) [CrossRef] [Google Scholar]
- K.-Y. Shin, J.S. Lee, J. Jang, Highly sensitive, wearable and wireless pressure sensor using free-standing ZnO nanoneedle/PVDF hybrid thin film for heart rate monitoring, Nano Energy 22, 95 (2016) [CrossRef] [Google Scholar]
- S. Chun, Y. Kim, H. Oh, G. Bae, W. Park, A highly sensitive pressure sensor using a double-layered graphene structure for tactile sensing, Nanoscale 7, 11652 (2015) [CrossRef] [PubMed] [Google Scholar]
- A. Bianco, H.-M. Cheng, T. Enoki, Y. Gogotsi, R.H. Hurt, N. Koratkar, T. Kyotani, M. Monthioux, C.R. Park, J.M.D. Tascon, J. Zhang, All in the graphene family − a recommended nomenclature for two-dimensional carbon materials, Carbon 65, 1 (2013) [CrossRef] [Google Scholar]
- A.V. Alaferdov, A. Gholamipour-Shirazi, M.A. Canesqui, Y.A. Danilov, S.A. Moshkalev, Size-controlled synthesis of graphite nanoflakes and multi-layer graphene by liquid phase exfoliation of natural graphite, Carbon 69, 525 (2014) [CrossRef] [Google Scholar]
- A.V. Alaferdov, S.M. Balashov, M.A. Canesqui, S. Parada, Y.A. Danilov, S.A. Moshkalev, Formation of thin, flexible, conducting films composed of multilayer graphene, Bull. Russ. Acad. Sci.: Phys. 78, 1357 (2014) [CrossRef] [Google Scholar]
- X. Li, R. Zhang, W. Yu, K. Wang, J. Wei, D. Wu, A. Cao, Z. Li, Y. Cheng, Q. Zheng, R.S. Ruoff, H. Zhu, Stretchable and highly sensitive graphene-on-polymer strain sensors, Sci. Rep. 2, 870 (2012) [PubMed] [Google Scholar]
- Y. Wang, L. Wang, T. Yang, X. Li, X. Zang, M. Zhu, K. Wang, D. Wu, H. Zhu, Wearable and highly sensitive graphene strain sensors for human motion monitoring, Adv. Funct. Mater. 24, 4666 (2014) [CrossRef] [Google Scholar]
- L. Gao, D. Dong, J. He, K. Qiao, F. Cao, M. Li, H. Liu, Y. Cheng, J. Tang, H. Song, Wearable and sensitive heart-rate detectors based on PbS quantum dot and multiwalled carbon nanotube blend film, Appl. Phys. Lett. 105, 153702 (2014) [CrossRef] [Google Scholar]
- S. Gong, W. Schwalb, Y. Wang, Y. Chen, Y. Tang, J. Si, B. Shirinzadeh, W. Cheng, A wearable and highly sensitive pressure sensor with ultrathin gold nanowires, Nat. Commun. 5, 3132 (2014) [PubMed] [Google Scholar]
- P. Zhao, N. Deng, X. Li, C. Ren, Z. Wang, Development of highly-sensitive and ultra-thin silicon stress sensor chips for wearable biomedical applications, Sens. Actuators A: Phys. 216, 158 (2014) [CrossRef] [Google Scholar]
- C. Pang, G.-Y. Lee, T. Kim, S.M. Kim, H.N. Kim, S.-H. Ahn, K.-Y. Suh, A flexible and highly sensitive strain-gauge sensor using reversible interlocking of nanofibres, Nat. Mater. 11, 795 (2012) [CrossRef] [PubMed] [Google Scholar]
- Y. Tajitsu, Piezoelectret sensor made from an electro-spun fluoropolymer and its use in a wristband for detecting heart-beat signals, IEEE Trans. Dielectr. Electr. Insul. 22, 1355 (2015) [CrossRef] [Google Scholar]
- S.W. Kim, S.B. Choi, Y. An, B. Kim, D.W. Kim, J.-G. Yook, Heart rate detection during sleep using a flexible RF resonator and injection-locked PLL sensor, IEEE Trans. Biomed. Eng. 62, 2568 (2015) [CrossRef] [PubMed] [Google Scholar]
- J.-W. Tsai, J.-J. Wang, Y.-C. Su, Piezoelectric rubber films for autonomous physiological monitoring systems, Sens. Actuators A: Phys. 215, 176 (2014) [CrossRef] [Google Scholar]
- S. Choi, Z. Jiang, A novel wearable sensor device with conductive fabric and PVDF film for monitoring cardiorespiratory signals, Sens. Actuators A: Phys. 128, 317 (2006) [CrossRef] [Google Scholar]
- Nacional de Grafite Ltda, Itapecerica, MG, Brazil, http://www.grafite.com/inicio_en.asp [Google Scholar]
- A.V. Alaferdov, R. Savu, T.A. Rackauskas, S. Rackauskas, M.A. Canesqui, D.S. De Lara, G.O. Setti, E. Joanni, G.M. De Trindade, U.B. Lima, A.S. De Souza, S.A. Moshkalev, Wearable, highly stable strain and bending sensor based on high aspect ratio graphite nanobelts, Nanotechnology 27, 375501 (2016) [CrossRef] [PubMed] [Google Scholar]
- M.A. Pimenta, G. Dresselhaus, M.S. Dresselhaus, L.G. Cançado, A. Jorio, R. Saito, Studying disorder in graphite-based systems by Raman spectroscopy, Phys. Chem. Chem. Phys.: PCCP 9, 1276 (2007) [CrossRef] [PubMed] [Google Scholar]
- A.R. Ubbelohde, F.A. Lewis, Graphite and its crystal compounds (Oxford at The Clarendon Press, London, 1960) [Google Scholar]
- X. Zhang, Q.Z. Xue, D.D. Zhu, Positive and negative linear magnetoresistance of graphite, Phys. Lett. A 320, 471 (2004) [CrossRef] [Google Scholar]
- A. Ballestar, P. Esquinazi, J. Barzola-Quiquia, S. Dusari, F. Bern, R.R. Da Silva, Y. Kopelevich, Possible superconductivity in multi-layer-graphene by application of a gate voltage, Carbon 72, 312 (2014) [CrossRef] [Google Scholar]
Cite this article as: Andrei V. Alaferdov, Raluca Savu, Mara A. Canesqui, Emilio Bortolucci, Ednan Joanni, Joao Peressinoto, Stanislav A. Moshkalev, Graphite nanobelts characterization and application for blood pulse sensing, Int. J. Metrol. Qual. Eng. 8, 5 (2017)
All Figures
|
Fig. 1 Schematic drawing showing: (a) the set-up used for the nanobelt films deposition and (b) the configuration used for sensor testing with the PDMS covered sensor (1) fixed on a medical belt and connected to a source-meter (2) for electrical measurements; photographs showing the sensor attached to the belt (c) and fixed on a men's neck for electrical measurements (d). |
| In the text | |
|
Fig. 2 (a) Typical Raman spectrum of GNBs; (b) AFM image of a single graphite nanobelt deposited over Si/SiO2 and (c) typical cross-section of this nanobelt taken in the region marked with the white line in (b). |
| In the text | |
|
Fig. 3 SEM images of the electrodes configuration used for electrical characterization of single graphite nanobelts: low (a) and high (b) magnification SEM images. Patterns with long pointed lines ended with large contact pads were designed to provide accurate electrical measurements. |
| In the text | |
|
Fig. 4 Electrical resistivity as function of temperature for a single nanobelt (a) and ultrathin film (b). The insets show the electrical configuration used for the measurements. |
| In the text | |
|
Fig. 5 Optical (a) and SEM (b) images of the PDMS surface covered by nanobelts deposited by LB technique, film density is higher for the (b) case. |
| In the text | |
|
Fig. 6 Normalized current vs time cycles obtained using a blood pulse sensor fixed by a simple medical belt fixed on: (a) a 28 old man neck and a 36 old woman neck and (b) neck and wrist of a 36 old woman. Operating voltage is of 0.4 V. |
| In the text | |
|
Fig. 7 Sensor sensitivity vs applied pressure for different voltages. |
| In the text | |
Current usage metrics show cumulative count of Article Views (full-text article views including HTML views, PDF and ePub downloads, according to the available data) and Abstracts Views on Vision4Press platform.
Data correspond to usage on the plateform after 2015. The current usage metrics is available 48-96 hours after online publication and is updated daily on week days.
Initial download of the metrics may take a while.