Open Access
Fig. 2
Download original image
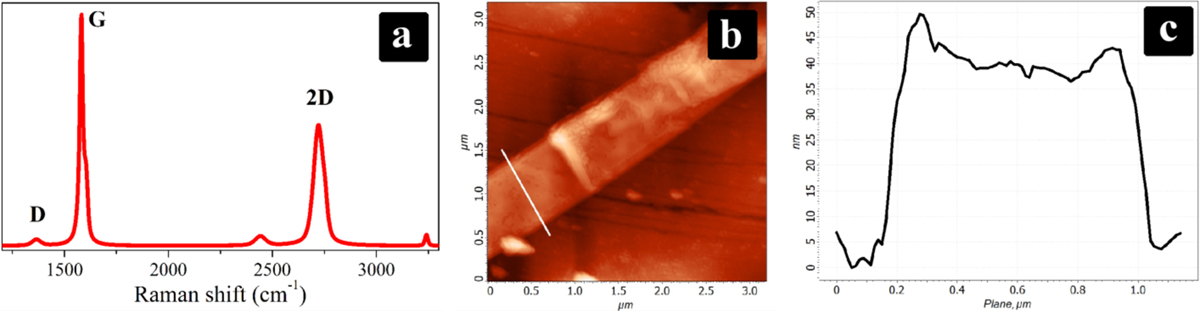
(a) Typical Raman spectrum of GNBs; (b) AFM image of a single graphite nanobelt deposited over Si/SiO2 and (c) typical cross-section of this nanobelt taken in the region marked with the white line in (b).
Current usage metrics show cumulative count of Article Views (full-text article views including HTML views, PDF and ePub downloads, according to the available data) and Abstracts Views on Vision4Press platform.
Data correspond to usage on the plateform after 2015. The current usage metrics is available 48-96 hours after online publication and is updated daily on week days.
Initial download of the metrics may take a while.