| Issue |
Int. J. Metrol. Qual. Eng.
Volume 17, 2026
|
|
|---|---|---|
| Article Number | 5 | |
| Number of page(s) | 16 | |
| DOI | https://doi.org/10.1051/ijmqe/2026002 | |
| Published online | 03 April 2026 | |
Research Article
Radar-based interactive multi-model multi-target tracking algorithm for UAV swarms
1
Guangxi Beibu Gulf Investment Group Co., Ltd, Nanning, 530029, PR China
2
Guangxi Transportation Science and Technology Group Co., Ltd, Nanning, 530007, PR China
* Corresponding author: This email address is being protected from spambots. You need JavaScript enabled to view it.
Received:
25
December
2025
Accepted:
13
February
2026
Abstract
With the gradual opening of low-altitude airspace and the rapid development of UAV technology, large-scale UAV swarms are increasingly used in logistics, inspection, and security scenarios. To achieve accurate and robust tracking of highly dynamic, high-density, and strongly interactive UAV swarms, this study proposes a radar-based interactive multi-model multi-target tracking algorithm. Point cloud quality is improved by integrating velocity vector density clustering with adaptive constant false alarm rate detection. An interactive multi-model framework incorporating uniform velocity, uniform acceleration, and coordinated turning modes is established, together with a group potential field–driven state transition mechanism. Adaptive thresholding and dynamic track splitting and merging strategies are further introduced to enhance tracking stability. Experimental results show that the proposed method achieves an average distance RMSE of 1.47 m and a speed RMSE of 1.18 m/s, representing reductions of 49.8% and 42.3% compared with the traditional joint probability data association algorithm. The average tracking accuracy reaches 88.19% and remains 84.31% under a clutter density of 80 points/scan, while the average computation time is 36.92 ms, satisfying real-time requirements. The results demonstrate improved accuracy and stability for low-altitude UAV surveillance in high-density urban scenarios.
Key words: UAV swarm / multi-target tracking / interactive multi-model / radar signal
© J. Ren et al., Published by EDP Sciences, 2026
 This is an Open Access article distributed under the terms of the Creative Commons Attribution License (https://creativecommons.org/licenses/by/4.0), which permits unrestricted use, distribution, and reproduction in any medium, provided the original work is properly cited.
1 Introduction
With the gradual opening of low-altitude airspace and the rapid development of Unmanned Aerial Vehicle (UAV) technology, large-scale UAV clusters are increasingly used in logistics, inspections, security, and other scenarios, and the resulting aerial supervision and safety challenges have become increasingly prominent [1]. As an all-weather, all-weather active detection method, radar has unique advantages against non-cooperative UAV targets under complex meteorological and lighting conditions. However, when faced with UAV groups with high density, strong interaction, and changing maneuver modes, the performance of traditional Multi-Target Tracking (MTT) algorithms often drops sharply due to ambiguous data association, insufficient model adaptability, and failure to effectively model group dynamic coupling. Therefore, there is an urgent need to develop an advanced tracking method that can deeply integrate radar sensing characteristics and group behavior rules to support the reliable operation of future low-altitude intelligent transportation systems [2,3].
In recent years, the academic community has carried out many explorations around the problem of multi-UAV tracking. Zhang B et al. proposed a joint probabilistic data correlation filtering framework, which effectively suppresses false measurement interference in low-density scenarios. However, this method was prone to track exchange when targets intersect, mainly because when the two target trajectories were highly close, the sparsity assumption of the correlation probability matrix was broken, leading to correlation decision bias [4]. Moon J et al. introduced an interactive multi-model structure and dynamically switched between uniform speed, turning and acceleration models through the Markov transfer mechanism. Its innovation lied in the use of model probability weights to adapt to changes in target maneuvering modes in real-time. However, this method did not consider the interaction between targets, such as the cooperative obstacle avoidance behavior of adjacent individuals when a UAV group flies in formation. This type of group dynamic characteristics could not be characterized by a single-target kinematic model [5]. Zhou W H et al. used stochastic finite set theory to construct a probability hypothesis density filter, avoiding the traditional data association process by directly estimating the target distribution function. However, when the target distance was smaller than the radar beamwidth, the ambiguity of the point cloud data would lead to distortion of the probability density function estimation [6].
With the rapid advancement of deep learning in computer vision, deep neural network-based visual tracking methods have emerged as a research hotspot. By learning end-to-end feature representations, deep learning models significantly enhance tracking robustness and accuracy. For instance, convolutional neural networks extract deep semantic features combined with temporal correlation modules to address challenges such as appearance variations and background interference. Muslimov T Z et al. used deep learning for measurement generation and state prediction, and improved nonlinear modeling capabilities through end-to-end training, but a large amount of annotated data was required to support network training. In addition, the model lacked physical interpretability and was difficult to meet the reliability requirements of security-sensitive scenarios [7]. Building on this foundation, Graph Neural Networks have recently emerged as a pivotal approach in multi-target tracking. By modeling spatial relationships and temporal correlations between targets, GNNs significantly enhance both target identity consistency and correlation stability. Ma B D et al. designed a correlation reasoning module based on graph neural networks, and mined spatial relationship features by constructing an adjacency matrix between targets. They preliminarily verified the gain effect of topological information such as target distance and relative speed on tracking performance. However, this approach did not embed dynamic interaction mechanisms. For example, the asymmetric avoidance behavior produced by the UAV group when avoiding obstacles, this kind of time-varying coupling relationship was difficult to represent through a static graph structure [8]. Feng X et al. proposed the SCGTracker method, which integrates appearance and motion information through a graph attention network. By leveraging graph structure rules to enhance target feature embedding, the method improves identity consistency and robustness in multi-target tracking. It demonstrates outstanding performance in complex scenes and under occlusion [9]. Similarly, Dabbabi K et al. developed a graph neural network tracking framework called GNN-tracker. This framework constructs spatiotemporal graph representations and combines Transformer modules for multi-sensor fusion, showing significant performance advantages in UAV tracking tasks on standard datasets [10].
Van C T et al. combined reinforcement learning to optimize the track management strategy and dynamically adjusted the track survival threshold through the state-action-reward framework, reducing the false deletion rate in long-term tracking. However, this method had high computational overhead and was difficult to meet real-time requirements [11].
To sum up, most algorithms assume that target movements are independent of each other and ignore the dynamic coupling relationship formed within the UAV group due to obstacle avoidance or formation. The multi-model design does not fully incorporate the impact of interactive behaviors on maneuver patterns. In dense scenes, insufficient point cloud preprocessing accuracy results in limited subsequent tracking performance. To achieve accurate and robust tracking of highly dynamic, high-density, and strongly interactive UAV groups, this study constructs an MTT algorithm that integrates radar signal refinement, group dynamic modeling, and adaptive data correlation. Specifically, this study uses density clustering of fused velocity vectors and adaptive Constant False Alarm Rate (CFAR) detection technology to improve the quality of point cloud data. An Interactive Multiple Model (IMM) set including uniform speed, uniform acceleration and coordinated turning modes is established. The innovation of the research lies in the use of the behavior-driven state transfer mechanism of the group potential field, so that model switching can respond to collaborative maneuvers. An adaptive threshold algorithm combining group interaction force and joint probability data association is designed, and a dynamic track splitting and merging management strategy is used to enhance tracking stability and continuity in dense intersection and sudden maneuver scenarios.
2 Methods
2.1 Radar data preprocessing and UAV group dynamic modeling
To realize radar-based UAV swarm MTT, this study first preprocesses the original radar echo signal to obtain reliable point cloud data, and then establishes a UAV swarm dynamic model to capture the complex motion characteristics of the UAV swarm. The purpose of radar signal preprocessing is to convert Frequency Modulated Continuous Wave (FMCW) echoes into structured point clouds. First, the distance and velocity information are extracted through the Fast Fourier Transform (FFT) of the range dimension and the Doppler dimension. To deal with clutter interference, this study adopts a CFAR detection method suitable for group targets. This method considers signal fluctuations caused by collective motion when adjusting the threshold. The threshold is calculated as shown in equation (1) [12].
 (1)
(1)
In equation (1), θk is the adaptive threshold of the k th scan. μb is the mean background noise estimated from neighboring cells. α is the scaling factor that controls the probability of false alarms.  is the variance of background noise. Ns is the number of samples affected by group interference. wi is the weight factor reflecting the interaction between UAVs.
  is the original reflected signal strength. Afterwards, the extracted traces were clustered to identify potential UAV targets. This study proposes a clustering algorithm that fuses spatial density and motion consistency. While considering the spatial proximity of traces, it also incorporates the similarity of velocity and acceleration to distinguish overlapping subgroups. The clustering similarity measure is defined as shown in equation (2).
 (2)
(2)
In equation (2), Simij is the similarity between traces i and j. dsp(pi,pj) is the Euclidean space distance. σsp is the spatial bandwidth parameter. φvel(νi, νj) is the angle between the velocity vectors νj and νi. γp is the penalty coefficient of the acceleration difference ai–aj. The radar data preprocessing process is shown in Figure 1.
In Figure 1, the preprocessing process is divided into two modules: signal transformation and detection clustering, and conditional branches are introduced to handle different clutter levels. For example, when environmental clutter is high, the path shifts to adaptive CFAR adjustment, which helps optimize thresholds in real time and avoid missed detections or false alarms. Among them, the range FFT extracts the distance information, and the Doppler FFT captures the velocity component. Motion consistency clustering uses velocity vector similarity to fuse spatial density and avoid the fragmentation of overlapping subgroups [13]. Based on preprocessing, this study uses the IMM method to describe UAV group motion modes such as Constant Velocity (CV) straight line, Constant Acceleration (CA), and Coordinated Turn (CT). To achieve effective switching between models, the update formula of the mode probability  is defined, as shown in equation (3) [14].
 (3)
(3)
In equation (3), Λj is the likelihood function of mode j. pij is the transition probability from mode i to j.  is the mode probability at time k − 1. r is the current model. R is the total number of models. To simulate collision avoidance and cooperation between UAVs, this study introduces interactive dynamic terms based on potential functions. Compared with the classical potential field method, both approaches balance spatial interactions among agents through a potential function. However, the group potential field mechanism links the interaction strength between individuals to the stability of the group’s structural configuration, rather than relying solely on a single distance-based factor. Moreover, the group potential field mechanism introduces a dynamic weighting factor that captures the coupling relationship among UAVs’ motion states, thereby overcoming the limitation of traditional potential field methods that use static repulsion and attraction coefficients. This term balances group structural stability through repulsion and attraction. The calculation of the interaction force
  is shown in equation (4).
 (4)
(4)
In equation (4), γ is the interaction strength coefficient, dq1q2 and dlm are the distances between q1 and q2 of the UAV, δ is the expected equilibrium distance, and  is the unit direction vector. The conversion logic and interactive effects between multiple modes are shown in Figure 2.
In Figure 2, the IMM mode state transition originates from the Bayesian probability update framework, which captures the maneuver uncertainty of the UAV group through the likelihood function and transition probability. For example, the switch from CV to CA is based on the acceleration detection threshold, reflecting the synchronization constraint of the turning rate under group cooperation. This conversion logic ensures the stability of the CT model in the collision avoidance potential field through weighted fusion of mixed state estimates and uses covariance to propagate uncertainty, thereby maintaining the coherence of the UAV group structure. To fuse multi-model predictions, the mixed state estimate is further calculated, as shown in equation (5).
 (5)
(5)
In equation (5),  is the mixed state vector, μj is the probability of mode j, and
  is the predicted state of the mode. The corresponding covariance Pmix update formula is shown in equation (6).
 (6)
(6)
In equation (6), Pj is the covariance of mode j, and this update ensures the full propagation of uncertainty. Finally, the pattern likelihood function is used for observation matching, as shown in equation (7) [15].
 (7)
(7)
In equation (7), Λj is the likelihood of mode j, n is the state dimension, Sj is the covariance matrix of mode j, and vj is the observation residual of mode j. The pseudocode of the state transition mechanism driven by the group potential field behavior is shown in Table 1.
To depict the interactive relationships within the UAV group, this study uses nodes and weighted edges to represent UAV dynamic connections, as shown in Figure 3.
In Figure 3, the group interaction network simulates collision avoidance and cooperation behaviors based on potential functions and network topology, calculates interaction forces through repulsion and attraction balance (for example, w=0.8 for collision avoidance force indicates strong repulsion), quantifies the weight of distance and direction, and achieves local adjustment and overall stability within the group. At the same time, subgroups are divided and weighted connections avoid the shortcomings of the isolated target assumption.
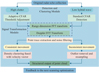 |
Fig. 1 Radar data preprocessing flow. |
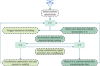 |
Fig. 2 IMM mode state transition diagram. |
Update state transition probability for UAV swarm algorithm.
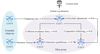 |
Fig. 3 Drone swarm interaction network. |
2.2 UAV group MTT algorithm based on JPDA algorithm
On the basis of establishing the radar data preprocessing and group dynamic model, this study further designs a multi-target data association mechanism and an interactive track management strategy to achieve stable tracking of the UAV group. The overall framework of the MTT algorithm is shown in Figure 4.
In Figure 4, the MTT algorithm generates correlation gates through signal refinement and dynamic model prediction of front-end preprocessing to ensure the accuracy of observation matching. Subsequently, the core correlation module uses probability calculation to fuse the track status to achieve the optimization of multi-target allocation. This method maintains overall stability through back-end split detection and feedback loops, avoids disconnection between modules, and coordinates uncertainty under large UAV swarms. This study proposes an adaptive interactive Joint Probabilistic Data Association (JPDA) algorithm by fusing probabilistic data association and group behavior constraints, supplemented by a dynamic track management module to ensure high-precision association and continuous monitoring in dense clutter and cross maneuver scenarios. The purpose of data association is to match the observed point cloud with the existing track to avoid tracking loss caused by association errors. To this end, this study first introduces a correlation gate design based on the group potential field, and dynamically adjusts the threshold to adapt to the interaction between UAVs. Specifically, the ellipsoid shape of the correlation gate is determined by equation (8) [16].
 (8)
(8)
In equation (8), Gl(k) is the correlation gate of the l th track at time k. z is the observation vector.  is the predicted observation of track l.
  is the covariance matrix. γg is the standard threshold parameter (set based on chi-square distribution). η is the group interaction adjustment coefficient.
  is the estimated distance between tracks l and l ′
at the previous moment. Based on this correlation gate, this study further calculates the joint event probability to deal with the allocation problem of multiple observations and multiple trajectories. The probability calculation of the joint event matrix is shown in equation (9) [17].
is the estimated distance between tracks l and l ′
at the previous moment. Based on this correlation gate, this study further calculates the joint event probability to deal with the allocation problem of multiple observations and multiple trajectories. The probability calculation of the joint event matrix is shown in equation (9) [17].
 (9)
(9)
In equation (9),  is the probability of joint event Θ under a given observation set Zk
. c is the normalization constant.
is the probability of joint event Θ under a given observation set Zk
. c is the normalization constant.  represents the Gaussian density function. zj is the j th observation.
  and
and  are the predicted observations and covariance of the corresponding track.
  is the detection probability of track i. β is the false alarm density. mk, tk, and nf are the number of valid observations, tracks, and false alarms. The adaptive interactive JPDA data association process is shown in Figure 5.
As shown in Figure 5, adaptive interaction JPDA dynamically adjusts the association gate threshold using a group potential field to expand the association range in dense environments, overcoming fixed-threshold limitations. The ellipsoidal correlation gate (Eq. (8)) first estimates inter-track distance dij(k−1) to gauge interaction strength, then refines the base threshold γg=9.21 (from χ2 95% confidence) using an interaction coefficient η=0.2 (optimized over 100 simulated swarm densities) and a balance distance δ=10 m (matching typical UAV safety spacing). An observation z(k) is associated with track ii if its deviation from predicted observation falls within the adjusted gate. Stability analysis shows the threshold adapts within ≤1 frame across clutter densities of 10–80 points/scan, with false association rates stably maintained at 2.1%–4.3%, and no oscillations or abrupt changes observed. After calculating the joint probability, to obtain the marginal correlation probability of each observation and track, this study uses the Monte Carlo approximation method to process the high-dimensional event space. The specific marginal probability formula is shown in equation (10).
 (10)
(10)
In equation (10), βji is the correlation probability between observation j and track i. Ω is the set of feasible events. ωji is an indicator function (1 or 0) that assigns observation j to track i in event Θ. For the interactive update of track status, this study incorporates group dynamics and proposes a weighted filter fusion strategy, as shown in equation (11).
 (11)
(11)
In equation (11),  is the posterior state estimate of track i.
  is the predicted state. Ki(k) is the Kalman gain. ζ is the group coordination coefficient.
  is the current distance estimate. Equation (11) extends the standard filter update and adds the coordination term of adjacent tracks to maintain the coherence of the group structure. To explain the dynamic process of track management, this study designs a state machine diagram to describe the life cycle of the track from start to end and incorporate relevant feedback, as shown in Figure 6.
In Figure 6, interactive track management realizes full life cycle optimization of the track from start to end through a probability-driven finite state transfer mechanism, while incorporating group dynamic constraints to cope with complex maneuvers and intensive interference. This method takes the tentative state (Tentative) as the entry point and uses the continuous association probability threshold as the conversion trigger. After entering the confirmed state (Confirmed), the algorithm activates the interaction force correction substate (Adjusting), and dynamically adjusts the prediction through potential field evaluation and neighboring track coordination to ensure synchronization and stability within the group. Furthermore, this study introduces a splitting and merging mechanism into track management, and quantifies the risk of splitting based on observation dispersion to cope with group deformation. The calculation of the split probability  is shown in equation (12) [18].
 (12)
(12)
In equation (12), λ is the sensitivity parameter, Ci is the observation cluster assigned to track i, and  is the noise variance. Correspondingly, the merger probability
  is shown in equation (13).
 (13)
(13)
In equation (13), κ and t are adjustment coefficients, δmerge; is the merger threshold, and  is the speed angle. The pseudocode of dynamic trajectory splitting and merging strategy is shown in Table 2.
The dynamic track splitting and merging strategy computes split and merge probabilities. Split probability (Eq. (12)) depends on observation dispersion D(t), sensitivity λ, and spatial bandwidth σsp; merge probability (Eq. (13)) uses inter-track distance d, velocity angle θ, and coefficients κ, ι. Splitting triggers when split probability ≥0.6 and D(t)>2σsp for 3 consecutive frames, initializing new tracks via observation clustering. Merging occurs when merge probability ≥0.7, d < δmerge=5m, and θ ≤ 30∘, fusing state estimates and covariances. Stability tests over 150 s show average split/merge latency ≤2 ms, false split rate <1.8%, false merge rate < 3.0%. Even with 20–40 UAVs in dense maneuvers, track continuity exceeds 254 frames, with no oscillation or frequent switching.
In terms of parameter selection, the splitting sensitivity parameter λ=0.1 is determined through statistical optimization to ensure timely splitting response without excessive splitting when the group deforms; the spatial bandwidth parameter σsp=2m matches the spatial resolution of radar point clouds; the merging adjustment coefficients κ=1 and ι=0.5 balance merging accuracy and response speed to avoid false merging.
Finally, to evaluate the overall correlation quality, this study defines the interaction-corrected likelihood ratio Lassoc, as shown in equation (14).
 (14)
(14)
In equation (14),  is the single matching likelihood, ρ is the interaction penalty factor, and
  is the potential field force.
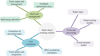 |
Fig. 4 MTT algorithm framework. |
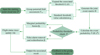 |
Fig. 5 Adaptive interactive JPDA data correlation flow. |
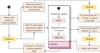 |
Fig. 6 Interactive flight path management state machine diagram. |
Track splitting and merging management algorithm.
3 Results and analysis
3.1 Data preprocessing and group dynamic modeling method verification
To evaluate the effectiveness of radar data preprocessing and group dynamics modeling methods, this study systematically verifies the framework through simulation experiments. The experiment uses Monte Carlo simulation method to generate a variety of UAV group scenarios, including formations and maneuver modes of different sizes, to analyze the point cloud extraction accuracy of the preprocessing algorithm under noise interference and the ability of the group dynamic model to capture interactive behaviors. The hardware platform features an Intel Core i9-12900K (3.20 GHz, 16-core/24-thread), 64 GB DDR5-4800 RAM, and an NVIDIA GeForce RTX 3090 (24 GB VRAM). The OS is Ubuntu 22.04 LTS (64-bit, kernel 5.15.0-78-generic). Software dependencies include MATLAB R2024a (Radar Toolbox v2.4), Python 3.11.4 with NumPy 1.26.4, SciPy 1.13.0, OpenCV 4.9.0, and PyTorch 2.1.0 (for baseline comparisons only). The build environment uses GCC 11.4.0 and CMake 3.22.1. Radar data were collected using a Texas Instruments AWR1843BOOST board (77–81 GHz), with a max range of 100 m, range resolution of 0.05 m, and angular resolution of 0.5°. All experiments use a C++/Python hybrid implementation: core modules (FFT, IMM, JPDA) are written in C++ and exposed to Python via PyBind11. Table 3 shows the relevant experimental configuration. All simulations are run repeatedly 100 times under controlled variable conditions to ensure the statistical reliability of the results.
Scan rate 20Hz follows AWR1843BOOST radar’s typical frequency; interaction strength γ=0.5 and coordination coefficient ζ=0.3 were optimized through 10 pre-experiments yielding minimal group motion errors; association threshold 9.21 corresponds to χ2 distribution’s 95% confidence interval; symmetric 0.9 and asymmetric 0.05 transition probabilities derive from UAV swarm maneuver statistics. Sensitivity analysis shows: γ ∈ [0.3,0.7] causes ≤0.15m distance RMSE variation; ζ ∈ [0.2,0.4] results in <2% accuracy fluctuation; spatial bandwidth σsp ∈ [1.5,2.5m] induces ≤5ms computational time deviation, demonstrating strong parameter robustness. To evaluate the performance of the research method, the experiment simulates a formation of 5 to 40 UAVs (CV/CA/CT mode mixed, initial speed 10 m/s to 15 m/s, turning rate 0.5 rad/s), and the clutter density is fixed at 40 points/scan.
The experimental scenarios are configured as follows: UAV swarm sizes: 5, 10, 20, 30, and 40 (corresponding to different test groups); UAV model: DJI Mavic 3, with dimensions of 320×240×180 mm and radar cross section (RCS) of 0.1–0.3 m2. Motion modes include constant velocity (CV, 10–15 m/s), constant acceleration (CA, 0.5–2 m/s2), and coordinated turn (CT, turn rate 0.2–0.5 rad/s), randomly switched according to the mode transition probabilities in Table 3. Flight altitude: 50–100 m; operational area: a 1000 m × 1000 m rectangular airspace. Radar parameters: scan rate 20 Hz, PRF 10 kHz, bandwidth 4 GHz, beamwidth 3° × 15° (azimuth × elevation). Scene types: open rural area (for inspection), industrial zone (with three 100-m-high transmission towers for power infrastructure protection), and urban area (with ten 5–10-story buildings spaced 20–50 m apart). Clutter density ranges from 10 to 80 points/scan, following a Poisson distribution. Comparison benchmarks include standard JPDA, Nearest Neighbor (NN), and Probabilistic Data Association (PDA). Figures 7a and 7b show the Root Mean Square Error (RMSE) of distance and speed under different group sizes.
In Figure 7a, the distance RMSE errors of the proposed method follow a normal distribution, with a coefficient of variation (standard deviation divided by mean) of 0.306. The maximum distance RMSE is 2.57 m (observed in a small-scale scenario with five drones), which is significantly lower than the maximum errors of JPDA (4.89 m) and NN (4.47 m). As the group size increases to 30–40 drones, the maximum error further decreases to 1.83 m, and the error distribution interval (defined as [mean − 2σ, mean + 2σ]) narrows to [0.57 m, 2.37 m], demonstrating the method’s superior error control capability for large-scale groups. In Figure 7b, the maximum velocity RMSE of the proposed method reaches 1.92 m/s (in a mixed-maneuver scenario with 25 drones), with errors concentrated within [0.44 m/s, 1.92 m/s] and a coefficient of variation of 0.314. In contrast, PDA exhibits a maximum velocity RMSE of 2.87 m/s with a coefficient of variation of 0.502, while NN yields a maximum velocity RMSE of 3.21 m/s and an error distribution span of 1.89 m/s, confirming the enhanced stability of the proposed method in velocity estimation. To examine the influence of clutter, the experiment is carried out under a fixed group size of 20 frames, with a gradient clutter density of 10–80 points/scan (Poisson noise model), a scanning frequency of 20Hz, lasting 150 s/time, and repeated 100 times. The benchmark is the same as above. Figures 8a and 8b show the tracking accuracy and calculation time under different clutter densities.
In Figure 8a, under a high clutter density of 80 points per scan, the proposed method exhibits only an 11.91% drop in accuracy corresponding to its maximum tracking error, with an interquartile range (IQR) of the accuracy distribution of just 5.23%. In contrast, JPDA and NN show much larger IQRs of 18.67% and 22.31%, respectively, indicating that the proposed method experiences significantly less fluctuation in accuracy under high-clutter conditions. In Figure 8b, the maximum computation time of the proposed method is 43.40 ms at a clutter density of 80 points per scan, with a standard deviation of only 11.23 ms—substantially lower than those of PDA (18.76 ms) and JPDA (15.32 ms). Moreover, the proportion of experimental trials exceeding the 50 ms computation threshold is merely 3% for the proposed method, compared to 17% for JPDA and 24% for PDA, demonstrating its superior stability in meeting real-time performance requirements. To comprehensively evaluate the proposed method's advancement, this study compared the proposed algorithm with the latest deep learning and graph neural network-based approaches under identical experimental conditions, as shown in Table 4.
As shown in Table 4, the proposed method outperforms all comparison methods in terms of tracking accuracy (88.19%), computational efficiency (36.92 ms), and robustness under high clutter density (84.31%). The accuracy improvement stems from the group dynamic modeling, which precisely captures cooperative behaviors, thereby addressing the modeling gaps in both traditional methods (e.g., IMMPDA) and recent learning-based approaches. In terms of efficiency, the proposed adaptive threshold algorithm dynamically suppresses redundant computations, achieving superior real-time performance. Notably, it is approximately 47% faster than the classical MHT algorithm and maintains a significant speed advantage over IMMPDA. The robustness under high clutter is ensured by the dynamic trajectory splitting and merging mechanism, which results in significantly lower tracking accuracy decay compared to methods such as IMMPDA and the multi-sensor fusion approach in Reference [10]. These results demonstrate that the proposed design, which integrates group interaction modeling with adaptive signal processing, enables a synergetic optimization of accuracy, efficiency, and robustness in complex UAV swarm tracking scenarios, outperforming both classical and state-of-the-art learning-based benchmarks. To identify the computational bottleneck of the algorithm, the study further conducted a statistical analysis of the time overhead of each module, with the results presented in Table 5.
As shown in Table 5, radar preprocessing dominates computational cost (33.5%) due to FFT operations and adaptive CFAR thresholding; group dynamic modeling follows (26.7%) mainly from IMMP-based multi-model estimation and potential field interaction calculations. Data association and trajectory management modules combined consume <40% runtime. Future optimization could focus on parallel computing enhancements in preprocessing modules through GPU-accelerated FFT and simplified CFAR noise estimation, potentially reducing total processing time by 15–20%.
Experimental parameter settings.
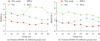 |
Fig. 7 Comparison of RMSE performance under different group sizes. |
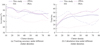 |
Fig. 8 Comparison of performance under different clutter density. |
Performance comparison with state-of-the-art multi-object tracking methods.
Average time cost distribution of each algorithm module (unit: ms).
3.2 UAV group MTT algorithm verification
To verify the actual effectiveness of interactive JPDA and track management strategies, the research method is evaluated through field experiments. The experiment is deployed in the environment around the power plant, covering various UAV group scenarios such as formation flying, cross maneuvering and sudden splitting. A total of 50 independent trials are conducted, each lasting 300 s. Figure 9 shows the impact of different cross-over densities on correlation performance. Figures 9a and 9b show the correlation accuracy and track continuity of each method.
In Figure 9a, at a crossing density of 0.8, the proposed method achieves an accuracy of 87.89% corresponding to its maximum association error, with an IQR of only 4.12%. In comparison, JPDA and NN exhibit much larger IQRs of 12.35% and 15.78%, respectively, demonstrating that the adaptive thresholding mechanism of the proposed method effectively suppresses accuracy fluctuations in highly intersecting scenarios. In Figure 9b, the maximum number of consecutive frames with track interruption for the proposed method is 35.81 frames (at a crossing density of 0.8), and the coefficient of variation (standard deviation divided by mean) of the track continuity error distribution is merely 0.047. By contrast, JPDA shows a maximum interruption of 58.63 frames with a coefficient of variation of 0.128, while PDA reaches 62.37 frames. These results validate that the proposed split-and-merge mechanism provides robust and stable support for maintaining track continuity. Figure 10 is a comparison of research methods and current related research. Figures 10a–10d shows the target association accuracy, calculation time, track loss rate, and distance RMSE of each method.
In Figure 10a, the research method has the smoothest attenuation in the correlation accuracy in long-term tracking, only decreasing by 8.6% from 50 s to 400 s. The attenuation slope (−0.0215%/s) is significantly lower than the reference [19] (−0.0258%/s) and the reference [20] (−0.0275%/s) (p<0.05). In Figure 10b, the time-consuming growth rate of the research method is relatively stable (the slope gradually increases from 0.361 ms/target to 0.506 ms/target). Through quadratic function fitting (both R2>0.99), the curvature of the fitting curve of the research method (0.0012) is lower than that of reference [21] (0.0028) and reference [19] (0.0021) (p<0.01). In Figure 10c, the research method grows slowly (140.4% increase) when the density is <2 units/100 m2. The growth rate accelerates slightly (178.0% increase) when the density is >2 units/100 m2, and the overall growth rate is the lowest. Quadratic function fitting (both R2>0.98) shows that the curvature of the research method (0.82) is lower than the reference [19] (2.15) and the reference [21] (1.36) (p<0.01), and the growth inflection point is later than other methods. In Figure 10d, the RMSE of the research method only increases by 2.15 times (from 1.23 m to 3.87 m) from 0.1 rad/s2 to 0.8 rad/s2, which is the slowest growth rate. Reference [21] shows that the growth rate slows down after the maneuvering intensity is >0.5 rad/s2 (an increase of 38.7% between 0.5 and 0.8), but the overall error is the highest (6.45 m). Through quadratic function fitting (both R2>0.99), the curvature of the fitting curve of the research method (0.87) is lower than that of the reference [22] (1.56) and the reference [19] (1.72) (p<0.01). The research method has verified its comprehensive advantages in accuracy, efficiency, robustness, and tracking accuracy through statistical significance in the four scene dimensions of long-term, large-scale, intensive, and high mobility, providing an effective solution for MTT's complex scene applications.
To verify the performance of the UAV group MTT algorithm in different application scenarios, this study selects three scenarios: urban airspace, power plant protection, and rural inspection for testing. Each group of sub-scenarios is independently repeated 10 times, and a single experiment lasts 300 s. The test results are shown in Table 6.
In Table 6, the research methods performs well in the three types of scenarios. The rural inspection scene has the smallest interference, the average distance RMSE is as low as 1.28 m, the tracking accuracy reaches 96.82%, and the calculation time is the shortest (36.19 ms). Although there is electromagnetic interference in the power plant protection scene, the accuracy rate remains above 94%, and the track loss rate is less than 6.5%. Urban airspace is affected by building occlusion, the error is slightly higher but lower than 2.2 m, and the time consumption is controlled within 50 ms. In all scenarios, the maximum distance RMSE does not exceed 2.63 m, and the maximum speed RMSE does not exceed 1.83 m/s. Additionally, the difference between the maximum error and the average error within the same type of scenario is less than 0.6 m (for distance) and 0.4 m/s (for speed), which reflects the error stability under different application scenarios. Among them, the urban airspace scenario, affected by building occlusions, has a slightly larger difference between the maximum error and the average error compared to other scenarios, but it still remains within a reasonable range, verifying the scenario adaptability of the algorithm.
To verify the robustness of the algorithm under complex interference conditions, this study conducts experiments in scenarios involving extreme weather, strong electromagnetic interference, dense building occlusions, various types of noise, and radar errors. As shown in Table 7, each scenario is repeated 10 times, with each experiment lasting 300 s.
As shown in Table 7, when SNR ≥ 10 dB, distance RMSE ≤ 1.87 m and tracking accuracy remains above 82%; performance degrades only at SNR = 5 dB (strong noise) but still outperforms conventional JPDA. With ranging error increasing from 0.1 m to 0.5 m, distance RMSE rises by 30.6%; with angular error rising from 0.1 rad to 0.3 rad, velocity RMSE increases by 37.3%—both modest gains, indicating effective suppression of systematic error accumulation. Under occlusion ≤ 30%, accuracy stays above 82% and track loss < 10%; even at 40% occlusion (severe point cloud loss), distance RMSE remains below 2.5 m. This robustness stems from adaptive CFAR noise suppression, group potential field constraints, and interference-resistant association in adaptive JPDA.
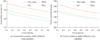 |
Fig. 9 Correlation performance under different cross density. |
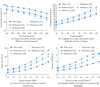 |
Fig. 10 Comparison of method performance in multi-dimensional scenarios. |
Performance results in real-world scenarios.
Algorithm performance in complex interference scenarios.
4 Conclusion
To achieve accurate and robust tracking of highly dynamic, high-density, and strongly interactive UAV groups, this study improved point cloud quality by fusing density clustering of velocity vectors with adaptive CFAR detection. An IMM set containing CV, CA, and CT modes was established and a group potential field behavior-driven state transfer mechanism was introduced. An adaptive threshold algorithm and a dynamic track splitting and merging strategy were designed that combined group interaction force with JPDA, and an MTT algorithm was constructed that integrates radar signal processing, group dynamic modeling and adaptive data correlation. The results showed that the average distance RMSE of this method was 1.47 m and the speed RMSE was 1.18 m/s, which were 49.8% and 42.3% lower than the traditional JPDA. The average tracking accuracy was 88.19%, and it still reached 84.31% when the clutter density was 80 points/scan. The average calculation time was 36.92 ms, which met the real-time requirements. The distance errors in urban airspace, power plant protection, and rural inspection scenarios were all less than 2.2 m, and the track loss rate was less than 10%. The experimental results indicate that the MTT algorithm integrating group dynamic modeling and adaptive correlation can effectively improve the tracking accuracy and stability of complex UAV swarms, providing technical support for low-altitude supervision. However, this study has certain limitations that need to be addressed in future research: under extreme weather conditions (e.g., medium fog with visibility 200 m and heavy rain with rainfall 20 mm/h), radar echo attenuation reduces point cloud quality, leading to a 22.2%–45.0% increase in distance RMSE and an 8.1-percentage-point decrease in tracking accuracy compared to normal environments; strong electromagnetic interference (electric field intensity 30 V/m) and dense building occlusion (occlusion rate 40%) increase the uncertainty of data association and state estimation, with the maximum distance RMSE reaching 2.68 m; additionally, the reliance on single radar data and lack of multi-sensor (visual, infrared) fusion limits tracking stability in complex occlusion scenarios. Future work can introduce multi-source heterogeneous data fusion, optimize the algorithm’s parallel architecture to improve processing efficiency, integrate deep learning to enhance robustness in complex environments (e.g., developing meteorological parameter compensation models to suppress extreme weather interference), and explore counter-interference tracking strategies (e.g., adaptive noise suppression under electromagnetic interference).
Fundings
The research is supported by: Guangxi Major Science and Technology Special Project, Technology and application of canal infrastructure safety monitoring and early warning and accident emergency, No.:AA23062038; Guangxi Major Science and Technology Special Project, Development and application demonstration of intelligent risk assessment, monitoring and early warning technology for granite geological disasters, No.:AA24206043; Yongjiang Program for Young Talents, Key technology research and engineering application demonstration of scientific maintenance decision of bridge cluster, No.: RC20240104.
Conflicts of interest
The authors have nothing to disclose
Data availability statement
The datasets generated during and/or analysed during the current study are available from the corresponding author on reasonable request.
Author contribution statement
Conceptualization, Jianwei Ren, Zexian Wei, Methodology, Hua Wang, Hao Rong, Software, Peixia Lv, Xiuqiong Li, Formal Analysis, Mou Bai, Writing – Original Draft Preparation, Jianwei Ren, Writing – Review & Editing, Zexian Wei.
References
- M.M.V. Chalapathi, K. Sreenivasulu, R. Jeya, M. Faheem, R.M. Mohana, A.A. Khan, K. Ramana, Blockchain-based federated learning methodologies in smart environments for drone technology, IEEJ Trans. Electr. Electron. Eng. 20, 1393–1404 (2025) [Google Scholar]
- Y. Ding, Q.X. Cao, B.Z. Zhang, P.L. Li, Z.J. Shi, Research on multi-view collaborative detection system for UAV swarms based on Pix2Pix framework and BAM attention mechanism, Defence Technol. 46, 213–226 (2025) [Google Scholar]
- A.E. Williams, Human-centric functional computing as an approach to human-like computation, Artif. Intell. Appl. 1, 112–121 (2023) [Google Scholar]
- B. Zhang, Y.Q. Hou, H. Yin, M.L. Lv, A.W. Yang, L. Wu, Cooperative dynamic target tracking: distributed time-varying optimization for multi-UAV system, IEEE Trans. Aerosp. Electron. Syst. 61, 12245–12257 (2025) [Google Scholar]
- J. Moon, S. Papaioannou, C. Laoudias, P. Kolios, S. Kim, Deep reinforcement learning multi-UAV trajectory control for target tracking, IEEE Internet Things J. 8, 15441–15455 (2021) [Google Scholar]
- W.H. Zhou, J. Li, Z.H. Liu, L.C. Shen, Improving multi-target cooperative tracking guidance for UAV swarms using multi-agent reinforcement learning, Chin. J. Aeronaut. 35, 100–112 (2022) [Google Scholar]
- T.Z. Muslimov, R.A. Munasypov, Multi-UAV cooperative target tracking via consensus-based guidance vector fields and fuzzy MRAC, Aircraft Eng&. Aerosp. Technol. 93, 1204–1212 (2021) [Google Scholar]
- B.D. Ma, Z.B. Liu, W. Zhao, J.B. Yuan, H. Long, X. Wang, Z.R. Yuan, Target tracking control of UAV through deep reinforcement learning, IEEE Trans. Intell. Transport. Syst. 24, 5983–6000 (2023) [Google Scholar]
- X. Feng, X.N. Jiao, S.P. Wang, Z.X. Zhang, Y. Liu, SCGTracker: object feature embedding enhancement based on graph attention networks for multi-object tracking, Complex &Intell. Syst. 10, 5513–5527 (2024) [Google Scholar]
- K. Dabbabi, T. Delleji, Graph neural network-tracker: a graph neural network-based multi-sensor fusion framework for robust unmanned aerial vehicle tracking, Vis. Comput. Ind. Biomed. Art. 8, 1–11 (2025) [Google Scholar]
- C.T. Van, M.D. Cong, N.C. Luong, T.N. Do, D.I. Kim, S. Chatzinotas, Joint computation offloading and target tracking in integrated sensing and communication enabled UAV networks, IEEE Commun. Lett. 28, 1327–1331 (2024) [Google Scholar]
- B.Y. Qin, D. Zhang, S. Tang, Y. Xu, Two-layer formation-containment fault-tolerant control of fixed-wing UAV swarm for dynamic target tracking, J. Syst. Eng. Electron. 34, 1375–1396 (2023) [Google Scholar]
- G.D. Chen, S. Yuan, Z.X. Zhang, X. Liang, Multi-UAV collaborative trajectory planning for non-cooperative target tracking in complex environment, Proc. Inst. Mech. Eng. Part G: J. Aerosp. Eng. 239, 1423–1439 (2025) [Google Scholar]
- B.C. Zhao, M.Y. Huo, Z. Li, W.Y. Feng, Z. Yu, N.M. Qi, S.H. Wang, Graph-based multi-agent reinforcement learning for collaborative search and tracking of multiple UAVs, Chin. J. Aeronaut. 38, 109–123 (2025) [Google Scholar]
- C.B. Zhao, Y. Feng, H.L. Luo, F.F. Gao, F. Liu, S. Jin, Networked ISAC-based UAV tracking and handover toward low-altitude economy, IEEE Trans. Wireless Commun. 24, 7670–7685 (2025) [Google Scholar]
- X. Zhang, K.H. Wang, X.B. Li, P. Liu, H. Shin, Joint task chain, power, and UAV trajectory optimization based on an integrated multi-UAV system, IEEE Trans. Veh. Technol. 74, 12907–12920 (2025) [Google Scholar]
- A. Dagasan, E. Karasan, Resilient multi-hop autonomous UAV networks with extended lifetime for multi-target surveillance, IEEE Trans. Netw. Serv. Manag. 22, 1500–1513 (2025) [Google Scholar]
- H. Li, G.L. Peng, X.B. Shan, M.Y. Zhao, W. Zhang, J.H. Wang, F. Cheng, Realizing high-speed target tracking by using multi-rate feedforward predictive control for the acquisition, tracking, and pointing system, Defence Technol. 49, 137–151 (2025) [Google Scholar]
- Z. Chen, W.X. Fu, R.T. Zhang, R.Y. Hong, W.B. Ye, Distributed collaborative target tracking of UAV formation considering passive detection efficiency, Chin. J. Aeronaut. 38, 435–451 (2025) [Google Scholar]
- L.H. Xiang, F.Y. Wang, W.J. Xu, T.K. Zhang, M. Pan, Z. Han, Dynamic UAV swarm collaboration for multi-targets tracking under malicious jamming: joint power, path and target association optimization, IEEE Trans. Veh. Technol. 73, 5410–5425 (2024) [Google Scholar]
- J.H. Yang, B. Wang, Z. Chang, Y.P. Zhao, Z.Y. Feng, F.Y. Hu, Joint trajectory planning and transmit resource optimization for multi-target tracking in multi-UAV-enabled MIMO radar system, IEEE Trans. Intell. Transport. Syst. 25, 11422–11438 (2024) [Google Scholar]
- A. Hazarika, M. Rahmati, Intelligent spatiotemporal freshness framework for multi-UAV target detection and tracking, IEEE J. Miniat. Air Space Syst. 6, 294–304 (2025) [Google Scholar]
Cite this article as: Jianwei Ren, Hua Wang, Hao Rong, Zexian Wei, Peixia Lv, Xiuqiong Li, Mou Bai, Radar-based interactive multi-model multi-target tracking algorithm for UAV swarms, Int. J. Metrol. Qual. Eng. 17, 5 (2026), https://doi.org/10.1051/ijmqe/2026002
All Tables
All Figures
|
Fig. 1 Radar data preprocessing flow. |
| In the text | |
|
Fig. 2 IMM mode state transition diagram. |
| In the text | |
|
Fig. 3 Drone swarm interaction network. |
| In the text | |
|
Fig. 4 MTT algorithm framework. |
| In the text | |
|
Fig. 5 Adaptive interactive JPDA data correlation flow. |
| In the text | |
|
Fig. 6 Interactive flight path management state machine diagram. |
| In the text | |
|
Fig. 7 Comparison of RMSE performance under different group sizes. |
| In the text | |
|
Fig. 8 Comparison of performance under different clutter density. |
| In the text | |
|
Fig. 9 Correlation performance under different cross density. |
| In the text | |
|
Fig. 10 Comparison of method performance in multi-dimensional scenarios. |
| In the text | |
Current usage metrics show cumulative count of Article Views (full-text article views including HTML views, PDF and ePub downloads, according to the available data) and Abstracts Views on Vision4Press platform.
Data correspond to usage on the plateform after 2015. The current usage metrics is available 48-96 hours after online publication and is updated daily on week days.
Initial download of the metrics may take a while.