Open Access
Fig. 6
Download original image
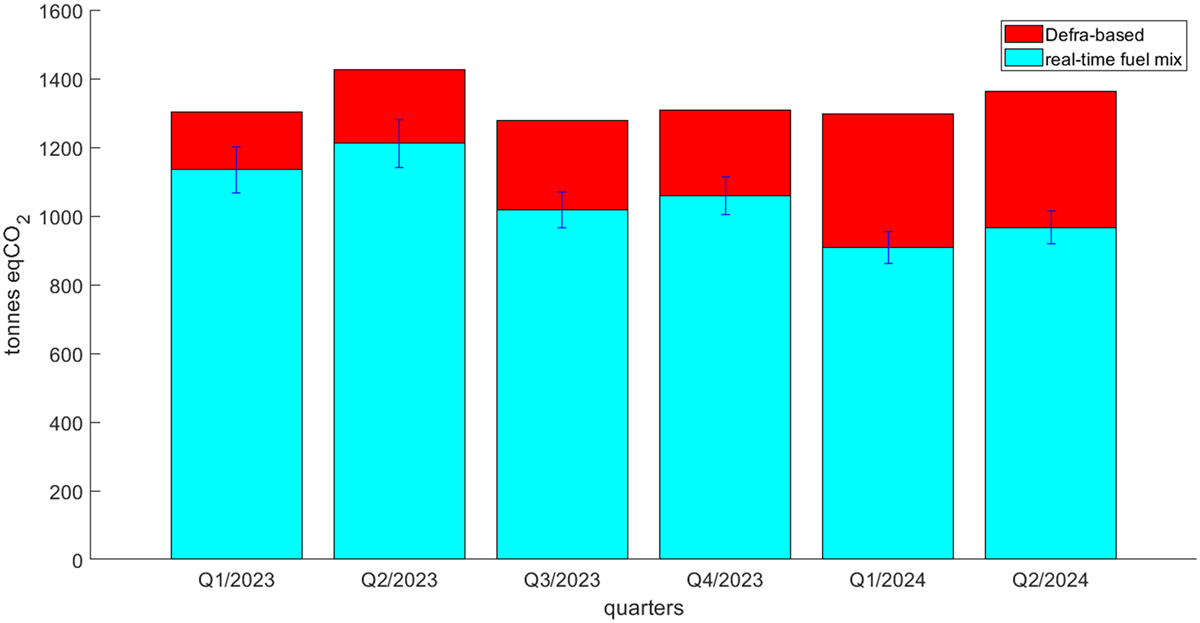
Comparison of aggregated quarterly carbon emissions of a large company based on annual Defra carbon factors (dark red bars) and actual fuel-mix-based carbon factor of the UK National Grid (light cyan bars with uncertainty bars).
Current usage metrics show cumulative count of Article Views (full-text article views including HTML views, PDF and ePub downloads, according to the available data) and Abstracts Views on Vision4Press platform.
Data correspond to usage on the plateform after 2015. The current usage metrics is available 48-96 hours after online publication and is updated daily on week days.
Initial download of the metrics may take a while.