


| Issue |
Int. J. Metrol. Qual. Eng.
Volume 17, 2026
|
|
|---|---|---|
| Article Number | 9 | |
| Number of page(s) | 13 | |
| DOI | https://doi.org/10.1051/ijmqe/2026005 | |
| Published online | 11 June 2026 | |
Research Article
Assessment of uncertainties in pressure and velocity measurements in ballistics using piezoelectric transducers and light screens
1
Military Academy, Fondouk Jedid, Grombalia, 8012 Nabeul, Tunisia
2
University of El Manar, National Engineering School of Tunis, LR11ES19 Laboratoire de Mécanique Appliquée et Ingénierie, 1002 Tunis, Tunisia
3
Science and Technology for Defense Laboratory, Center for Military Research, l’Aouina, Base Militaire Aouina, 2045 Tunis, Tunisia
* Corresponding author: This email address is being protected from spambots. You need JavaScript enabled to view it.
Received:
28
May
2025
Accepted:
20
May
2026
Abstract
Metrology has become the inevitable guarantee to gain confidence in all areas of industry and science. In the specific field of ballistics, significant technological progress has been achieved in recent years in terms of measurement means and techniques, including high-speed data acquisition, improved piezoelectric pressure sensors, advanced digital signal processing techniques and modern optical velocity measurement systems. These developments contribute to improving the reliability and performance of both weapons and ammunition, thereby mitigating potential risks to human life and economic losses. However, the traceability of measurement results is not always obvious due to the absence of primary standards for certain physical quantities or the difficulty of estimating measurement uncertainties. Within the framework of the accreditation of the ballistics laboratory according to the requirements of the ISO/IEC 17025 standard, significant efforts have been undertaken to contribute to the establishment of a well-founded approach for the assessment of uncertainties of the main measurable quantities in ammunition proof tests, namely the ballistic pressure and the flight velocity of the projectile using piezoelectric transducers and light screens. In addition to the technical aspects of measurement, this work aims to highlight the factors that significantly affect the uncertainty of projectile velocity and gas pressure measurements. First, possible sources of measurement errors are determined, then their elementary contributions to the uncertainty are estimated. Finally, global uncertainties are evaluated based on the propagation of variances as mentioned in the guide to the expression of uncertainty in measurement (GUM). Furthermore, the validity of these uncertainties has been verified using the Monte Carlo method in accordance with Supplement 1 of the GUM. The required simulations were performed by the LNE-MCM software (Laboratoire National de Métrologie et d’Essais – Monte Carlo Method). The results obtained allow us to implement a practical method for estimating the uncertainty of measurement of the most sought-after ballistic quantities, considering their importance in evaluating the performance of firearms and their ammunition according to standards in the field of ballistics.
Key words: Uncertainty of measurement / ballistics / pressure / velocity / GUM / Monte Carlo
© L. Elkarous et al., Published by EDP Sciences, 2026
 This is an Open Access article distributed under the terms of the Creative Commons Attribution License (https://creativecommons.org/licenses/by/4.0), which permits unrestricted use, distribution, and reproduction in any medium, provided the original work is properly cited.
1 Introduction
Internal ballistics studies the phenomena inside the barrel of a weapon, from the moment the trigger is pulled until the projectile exits the muzzle. It is a sequence of complex physicochemical events that takes place in a very short time interval of the order of milliseconds. The energy released by the hot gases is transformed into motion thanks to the work of the pressure forces on the base of the projectile [1–4]. The work of the pressure forces therefore converts the chemical energy of the powder into kinetic energy of the projectile. This kinetic energy should be sufficient for the projectile to reach its target and cause the desired damage. The assessment of the reliability and performance of weapons and ammunition deeply depends on the accuracy of measurement techniques in accordance with international standards. In fact, excessive pressure can damage the weapon, while insufficient pressure can lead to reduced performance of the projectile [5].
Methodologies and procedures for measuring the ballistic performance of small caliber ammunition were established in the NATO the Allied Engineering Publication 97 (AEP-97), entitled Muli-Calibre Manual of Proof and Inspection (M-CMOPI) for Small Arms Ammunition, published in November 2020 [6]. This standard is one of the most widely used references by manufacturers and defense organizations to ensure that ammunition meets NATO’s requirements for military operations. It serves as a technical manual providing step-by-step instructions and procedures for the implementation of STANAG 4823 (2020) which only specifies the policy-level requirements for EPVAT testing [7].
Electronic Pressure Velocity and action time (EPVAT) testing is one of the three recognized techniques used in the world to control the quality and the safety of ammunition. The EPVAT method is a reference in the internal ballistic field due to its accuracy and standardization, but it is expensive and technically demanding. Regular calibration and verification of the equipment are frequently required because the results can be influenced by external factors such as ambient temperature, humidity or variations in ammunition materials. Compared with other standards, the civilian organizations C.I.P. (Commission Internationale Permanente pour l'Epreuve des Armes à Feu Portatives) and SAAMI (Sporting Arms and Ammunition Manufacturers' Institute) use less complex evaluation procedures than NATO [2].
The EPVAT technique measures three key parameters during firing: the maximum pressure generated in the case mouth chamber, the velocity of the projectile upon exiting the barrel, and the action time (AT) elapsed between cartridge priming and exit. Piezoelectric transducers are the primary pressure measurement techniques. Combined with a charge amplifier and a real-time data acquisition system, it measures pressure variations throughout the combustion cycle, providing a pressure-time curve essential for ballistic analysis [2,6]. Additionally, light screens are recommended for measuring projectile velocity during ballistic testing because they are accurate, non-invasive, and relatively easy to install compared to other methods such as Doppler radar. It is an optical chronograph that uses the interruption of light beams to determine the velocity of a projectile as it passes through the screens [8].
Within the framework of the accreditation of the ballistics laboratory according to the requirements of the ISO/IEC 17025 standard, efforts have been undertaken in the assessment of uncertainties of the main measurable ballistic quantities in ammunition proof tests, particularly concerning the peak pressure and the flight velocity of the projectile using piezoelectric transducers and light screens. The combined uncertainty is evaluated following the Guide to the Expression of Uncertainty in Measurement (GUM), as outlined in ISO/IEC Guide 98-3, using a first-order Taylor series approximation for the Law of Propagation of Uncertainty (LPU) [9]. Then, the validity of these uncertainties assessment according to LPU has been verified using the Monte-Carlo Method (MCM) in compliance with Supplement 1 of the GUM (ISO/IEC 98-3/S1) [10]. The required simulations were performed by the LNE-MCM software [11].
Normally, Supplement 1 of the GUM provides a numerical alternative to LPU using Monte-Carlo simulations when the model is strongly nonlinear, or input distributions are asymmetric. According to paragraph 5.1.2 of ISO/IEC Guide 98-3, when the nonlinearity of the model is significant, higher-order terms in the Taylor series expansion must be included. Indeed, when input quantities are nonlinearly correlated, LPU requires an accurate covariance matrix, something which a Monte-Carlo analysis naturally handles. However, even if the GUM gives plausible results for weakly non-linear models, a Monte-Carlo check is judicious to confirm the robustness especially when the correlations are not considered or when there are doubts about the output distribution (often assumed normal by the GUM according to the central limit theorem). As already mentioned, since GUM relies on a linear approximation, LPU may underestimate the uncertainty if the model exhibits significant nonlinearity.
Since the validity domain of the MCM is broader than that of the GUM uncertainty framework, it is recommended to apply both methods and compare the results. If the results agree, the GUM framework may be used for this case and similar future problems. Otherwise, the MCM or another suitable method should be considered. Supplement 1 (GUM-S1) defines a criterion for validating the GUM uncertainty framework using a Monte Carlo method. The objective of a comparison procedure is to determine whether the coverage intervals obtained by the GUM and MCM uncertainty framework agree within the limits of a stipulated numerical tolerance [10].
For this ballistic assessment, the EPVAT (Electronic Pressure Velocity and Action Time) measurement technique was first outlined, with particular attention given to the instrumentation chain employed. The sources of measurement errors are then described and their individual contributions to the uncertainty are estimated. The primary objective of this study is the implementation of a practical methodology for estimating measurement uncertainties associated with the most key ballistic parameters. These parameters are essential for the reliable evaluation of firearm and ammunition performance in accordance with the AEP-97 standard.
Furthermore, it should be noted that research work related to the assessment of measurement uncertainty of physical quantities of internal ballistics is quite rare. Regarding ballistic pressure, Elkarous et al. studied the different sources of measurement uncertainties in the context of developing a dynamic calibration method for piezoelectric sensors for pressure measurement [12,13]. In addition, some works published by different organizations have looked at the sources of errors during the calibration of piezoelectric sensors without going into details [14–18]. Furthermore, Paulter [8] and Vitek [19] have published valuable work regarding the assessment of uncertainties associated with the use of light screens coupled with a waveform recorder for velocity measurement. The objective is to improve the reliability of measurements, which are essential for evaluating the performance of weapons, ammunition and ballistic protective material.
2 Equipment and setup
The ballistic pressure generated in a firearm's barrel during firing is a dynamic quantity that varies rapidly over time, within milliseconds, making accurate measurement difficult. Similarly, the velocity of the projectile exits the barrel often at supersonic speeds. These two parameters are important for ballistic measurements because they influence the safety and effectiveness of firearms and ammunition. Furthermore, these challenges are compounded by environmental factors such as temperature fluctuations and mechanical vibrations, which can affect sensor readings.
To conduct a test using the EPVAT technique, the measurement chain essentially consists of two piezoelectric sensors, a charge amplifier, a data acquisition system and a computer equipped with appropriate software for displaying and processing the measurements. At the Ballistics Laboratory of the Military Academy, we have a complete measuring chain to measure the ballistic pressure and the velocity of the projectile according to the EPVAT technique as recommended by NATO. Figure 1 below illustrates the different measuring instruments of this measuring chain, which is mainly composed of High-Pressure Instrumentation (HPI) brand equipment.
For pressure measurement, the components of the measuring chain ensure three main functions to read the measurements on our computer screen. The first function is to convert the physical quantity to be measured into an electrical quantity, based on the piezoelectric effect. Then, the signal conditioner, which consists of charge amplifier with data acquisition unit (DAQ) converts, amplifies and performs the necessary filtering into this electrical signal to eliminate noise and the effect of parasitic signals. Finally, the digital signal is displayed, read and processed on a display unit by suitable software.
The measurement is triggered by the signal from the weapon's firing pin, and its stopping is ensured by a muzzle flash detector. An electrical pulse is generated by the latter when detecting the muzzle flash generated by the re-ignition of combustion gases after the projectile leaves the barrel muzzle.
Figure 2 below gives more details of piezoelectric pressure transducers mounting in the barrel according to EPVAT technical requirements.
For signal conditioning, the HPI B216-Data Recorder (DR) acquire an analog signal generated by the piezoelectric pressure transducer HPI GP6 and a time interval. Two combined units B216-DR are used and connected for the measurement to fulfill an EPVAT test. The piezoelectric pressure transducer, with a sensitivity S (pC/MPa), converts the pressure P (MPa) into a charge signal Q = S.P (pC). Via the low noise signal cable, the charge signal is transferred to the charge amplifier and converted into a voltage signal U (V). If required, a Filter with a chosen frequency can be applied.
According to the technical specifications of this device, the drift related to the charge amplifier is less than 0.05 pC/s [20]. It also specified that the drift obtained in 2 s is less than 1 pC. Furthermore, the B216-DR has a digitizer (A/D converter) with a resolution of 16 bits and a maximum sampling rate of 10 MHz for the data acquisition (DAQ). The manipulation and setting of the B216-DR are performed via the HPI B3000 BWF software module for the signal processing, evaluation and reporting of measured data.
Figure 3 gives an overview of the signals along the measuring chain and gives a simplified equivalent electrical circuit for piezoelectric transducer, cable and charge amplifier.
The signals delivered by the piezoelectric pressure transducer (charge mode sensors) are low amplitude and very high impedance. The piezoelectric sensor is a time-varying charge generator. Therefore, its equivalent electrical diagram can be represented by a current source in parallel with the capacitance Cs of the dielectric between the two electrodes and a leakage resistance Rs, also characteristic of the dielectric. Similarly, the connecting cable, generally represented by a capacitor Cc and a resistor Rc, must also be considered.
The charge amplifier consists essentially of a high-gain inverting voltage amplifier with a MOSFET or J-FET at the input to achieve high isolation resistance. Generally, it has two stages. The first stage is a very high-gain operational amplifier that uses a feedback capacitor Cr that converts the charges into voltage. The second stage provides voltage gain. A feedback resistor Rr is placed in parallel with the capacitor to protect it against charging and discharging.
The system’s low frequency response is determined by the time constant (RrCr). Time constant and drift simultaneously affect a charge amplifier’s voltage output, but one dominates. Drift is an undesirable change in output signal over time, which can be caused by low insulation resistance or by leakage current. According to the technical specifications provided by the manufacturer, the charge amplifier drift rate remains less than 0.05 pC/s [20].
In practice, the effects of Rs and Rc can be neglected. Thus, the resulting output voltage U is given by:
 (1)
(1)
For sufficiently high open loop gain A, the transducer and cable capacitance can be neglected. Therefore, the output voltage depends only on the input charge Q and the feedback capacitance Cr.
 (2)
(2)
From Figure 3, the ballistic pressure measured by measuring chain is given by the following relation:
 (3)
(3)
where the S (pC/MPa) is sensitivity of the sensor, U (V) is the maximum voltage delivered by the measuring chain, P (MPa) is the ballistic pressure and  (mV/pC) is the gain of the charge amplifier.
The HPI B472 Light Screen is a precise instrument for measuring projectile velocity of individual shots and fire bursts. It consists of two measuring frames held in place with distance tubes to form a two-meter measuring base. The time is measured, and signals are processed in the B472-TR time recorder. This time-recorder processes the signals, measures the time and supplies the power to the transmitter and the receiver. This information is then transmitted to the PC via an LAN interface.
The measuring frame consists of two 40 × 100 mm section tubes bolted to two 40 × 40 mm tubes to form a stable frame measuring 900 × 1200 mm. The 40 × 100 mm sections contain the IR LED transmitter and IR LED receiver as well as the sockets for the power supply. The effective sensor area between the transmitter and receiver of the measuring frame is 600 × 1000 mm.
As shown in Figures 4, when the projectile passes through a light screen, it blocks the incident light and creates a shadow signal which is amplified and converted into a digital signal by a precision trigger circuit. For each light screen, an electrical signal is generated and the delay between these two signals is the propagation time between the two screens (tLS) which are separated by well-known distance (dLS) [21].
The instantaneous velocity of the projectile, calculated at the middle of the light screen, is given by the following formula:
 (4)
(4)
According to the manufacturer, any interference signals shorter than 12 μs, caused for example by compressed air, sound or shock waves, are suppressed. The length of the digital signal corresponds to the flight time of the projectile through the sensor area. At the projectile nose, this signal is delayed by 12 μs ±50 ns. In addition, the digital signals for start and stop are connected to the inputs of the timer card in the time recorder. The counter card contains inputs with 20 MHz (50 ns) clock frequency. To avoid system errors (projectile penetration at inclined angle) the light screen (sensor area) must be aligned at right angles to the projectile flight path. A sensor area angle of 1.8 degrees in relation to the flight path will make the measuring base 1 mm longer, corresponding to an error of 0.5‰ [21].
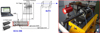 |
Fig. 1 Gas pressure and projectile velocity measurement according to EPVAT technical specifications [17]. |
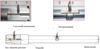 |
Fig. 2 Pressure transducers mounted in the barrel. |
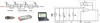 |
Fig. 3 Simplified equivalent electrical circuit for piezoelectric transducer, cable and charge amplifier. |
3 Uncertainty quantification of ballistic pressure and projectile velocity
For estimating the uncertainty of ballistic pressure and projectile velocity measurements, LPU methodology has been applied using first-order Taylor series approximation as stated in GUM (ISO/IEC Guide 98-3) [7]. This technique offers an analytical framework for evaluating uncertainty by systematically determining the contribution of various sources of errors.
The methodology consists of: (1) defining the corresponding mathematical function that relates the measurand and its associated input variables, (2) determining all relevant sources of uncertainty, (3) estimating standard uncertainties (Type based on statistical analysis, Type B based on non-statistical assessment), (4) combining these uncertainties employing the LPU, (5) determining the extended uncertainty after applying (usually k = 2 for 95% confidence) coverage factor, and (6) presenting the measurement result, the estimation of uncertainty, and the associated measurement result.
In order to obtain combined (global) uncertainty, each significant error source affecting the ballistic parameters needs to be evaluated using an appropriate distribution (normal, uniform, triangular, etc.). The individual uncertainties are then combined according to LPU rules, whereby they are added up as the square root of the sum of their variances (Eq. (5)).
The combined-standard uncertainty.
 (5)
(5)
Type A assessment of uncertaintys is the standard-deviation of the mean value of “n” repeated measurements.

The empirical mean value and the empirical standard deviation of “n” repeated measurements.

Type B uncertainty: estimated from the random errors. f is a function of different parameters xi and u(xi) is the standard uncertainty of each error source, supposed here to be independent and approximately linear.

To conduct an EPVAT test, a proof barrel equipped with two HPI GP6 piezoelectric pressure sensors and a light screen chronograph was used to measure the ballistic pressure and projectile velocity (Figs. 1 and 2). A total of thirty (30) 5.56 × 45 mm NATO SS109 ammunition was fired. The results of peak ballistic pressure (Pmax) at case mouth and port, as well as the projectile velocity at 10 m (V10), are presented in Figures 5 and 6.
The pressure variation curves in function of time measured by both case mouth and port transducers are shown in Figure 7. Table 1 summarizes the key parameters associated with the measurements of pressure and projectile velocity.
A sampling frequency of 2 MHz for pressure data acquisition was selected while a second-order Bessel low-pass filter with a cutoff frequency of 20 kHz was used to filter pressure signal according to the AEP-97.
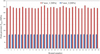 |
Fig. 5 Peak pressure of NATO SS109 for 30 rounds. |
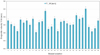 |
Fig. 6 Projectile velocity of NATO SS109 for 30 rounds. |
Peak ballistic pressure and projectile velocity.
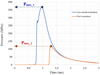 |
Fig. 7 Case mouth and port pressure measurement. |
3.1 Uncertainty analysis of projectile velocity
According to Table 1, the arithmetic mean velocity (v) of the SS109 bullet is 926.39 m/s, with a standard deviation (s) of 3.57 m/s. The measurement uncertainty was calculated by combining the contributions of sources related to the distance (dLS = 2 m) and the fly time ( ). To do this, the uncertainty sources were first identified from the technical specifications (TS) and calibration certificates (CC). Then, the appropriate distribution for each source was defined. Finally, the standard uncertainties were computed.
According to equation (4), the Type B evaluation of measurement uncertainty of the projectile velocity was calculated as follows:
 (6)
(6)
where u(dLS) and u(tLS) are the uncertainties respectively in the distance and the fly time of the projectile between the two light screens. These two uncertainties are assessed in the next two sections. Apparently, the mathematical model of projectile velocity is nonlinear in tLS. The nature of this linearity will also be investigated as well.
3.1.1 Evaluation of distance uncertainty
Potential sources of error in measurements with the light screen include the determination of the distance between the screens, the alignment of the light screen with the projectile’s trajectory, the yaw effect of the projectile and the effect of temperature on material expansion. The distance between the two screens of the optical-infrared base is measured using a tape measure. Table 2 below summarizes the contribution to uncertainty of each source to the uncertainty in distance.
Uncertainty budget in distance.
3.1.2 Evaluation of time uncertainty
Potential sources of error include mainly the time resolution of the counter, trigger accuracy and electrical noise. Table 3 summarizes the contribution to uncertainty of each source to the uncertainty in time.
Based on equation (6), the combined type B uncertainty of the velocity of projectile (uB) is around ±0.61 m/s. Table 4 gives the expanded uncertainty after the Type A uncertainty was considered.
Analysis of the projectile velocity uncertainty, measured using the infrared light-screen system, showed that Type A and Type B uncertainty evaluations contribute almost equally. However, uncertainty in distance measurement dominates the overall velocity uncertainty due to its larger sensitivity coefficient and its more significant relative error compared to time measurement (0.43% versus 0.05% for time).
While the electronic clock’s high resolution (50 ns) minimizes temporal uncertainty, the dominant sources of distance uncertainty include tape measure resolution limit, uncompensated thermal expansion and potential misalignment of infrared display. These factors represent are key elements to enhance the accuracy of velocity measurements using this infrared measurement system.
Uncertainty budget in time.
Measurement uncertainty of projectile velocity.
3.2 Ballistic pressure measurement uncertainties
Based on Table 1, the arithmetic means of peak pressure (Pmax_1) and (Pmax_2) are respectively 343.70 MPa and 116.61 MPa, with standard deviations (s) of 7.29 MPa and 0.77 MPa. The peak pressure uncertainty was calculated by combining the contributions of sources related to the transducer and the signal charge amplifier.
According to equation (3), the measurement uncertainty of the peak pressure based on LPU is calculated as follows:
 (7)
(7)
From equation (7), it is noticed that the combined uncertainty on the measurement of the peak ballistic pressure can be estimated from the standard uncertainties on the input quantities, namely the voltage U, the sensitivity of the sensor S and the gain of the charge amplifier G.
The characteristic parameters of the piezoelectric transducer are key parameters in the calculation of ballistic pressure measurement uncertainties, including its sensitivity, linearity and the accuracy of the used calibration system. For that, the piezoelectric sensor must be calibrated before conducting a measurement campaign, in accordance with the requirements of the NATO AEP-97 standard.
This operation was carried out with the continuous high-pressure HPI B630 generator monitored by a computer coupled to a control unit which consists mainly of built in 2-channel charge amplifier and charge calibrator with a reference capacitor (Cref = 1503.9 pF). Pressure is built up continuously by the B630's piston-cylinder to the predefined maximum pressure (Pref) by way of a ramp and reset to the atmospheric pressure again (Fig. 8). The reference sensor HPI GP8 (already calibrated by stepwise calibration to determine its sensitivity Sref) converts this reference pressure into an electrical charge signal (Qref). Based on this, the reference pressure on each point of the rising curve is known ( ). The accuracy of the entire calibration system is ±0.2% according to the technical specifications provided by the manufacturer.
Likewise, the tested sensor (GP6) generates a charge (Qtest) proportional to the applied pressure. The B630 software calculates this charge based on the recorded voltage and the reference capacitor ( ). Hence, the sensitivity (Si) of the tested sensor for each pressure level (i) is calculated as the ratio between the generated charge and the applied pressure as presented in Figure 9 (left).
The mean sensitivity (S) is calculated according to the tolerance band method which means that a straight line runs through the origin so that a flanked pair of parallel lines with minimum distance includes all measurement values as shown in Figure 9 (right). The distance between the flanked pair of parallel lines (2 × ΔQ) is the base for the calculation of sensor linearity L (%).
In addition, the contribution of the charge amplifier gain accuracy must be considered in the calculation of the uncertainty budget. However, the manufacturer's specifications do not provide any information on the gain accuracy of the charge amplifier, nor on the output of the acquisition card which is displayed on the signal processing software. To achieve this, the gain accuracy of the charge amplifier was determined based on the method explained by Elkarous et al. [12].
A verification of the gain of the charge amplifier with a 10 MHz frequency generator and the reference capacitance (Cref) allows to determine its tolerance over a frequency band from 100 Hz to 250 kHz. Electrical signals were recorded and analyzed by a digital storage oscilloscope (DSO) (Fig. 10, left).
The data acquisition card (DAQ) gain tolerance was characterized using an HPI B202 voltage generator and reference capacitor (Cref) (Fig. 10, right). Measurements revealed a maximum gain tolerance of approximately 0.4% for the DAQ. The charge amplifier demonstrated stable performance across the frequency range, with its maximum amplitude accuracy remaining at about 0.3%.
Furthermore, the uncertainty contribution from the B216 DR drift rate can be considered negligible. Based on the ballistic pressure measurement duration of 3 ms and the sensor sensitivity of 3.11 pC/bar, the resulting uncertainty is approximately of  . This value is sufficiently small to be disregarded in the overall uncertainty budget.
Here, it should be mentioned that all the equipment used in the verification and characterization of the measuring chain was calibrated by DEFNAT, a conformity assessment body accredited by the Tunisian National Council (TUNAC) and traceable to primary time-frequency standards.
The main sources of uncertainty, as well as their contribution to the overall uncertainty of the peak pressure measurement at case mouth (Pmax 1) are presented in Table 5.
The uncertainty budget for pressure measurement was quantified based on the technical characteristics and calibration documentation of the equipment in the measurement chain and using the law of propagation variance as illustrated in equation (7). However, determining the contribution of certain error sources was not always feasible due to the need to deploy additional traceable measurement instruments.
The reference sensor used for calibrating the pressure sensors was itself calibrated using a deadweight tester (quasi-static calibration). As a result, the dynamic effect of measurement remains difficult to quantify precisely, particularly those coming from the ballistic pressure variations during powder combustion. To take this phenomenon into account, a dynamic effect uncertainty of 0.5% was applied, based on the technical specifications of the sensors. While this estimate provides a reasonable approximation, further validation through dynamic calibration or high-speed reference measurements would be necessary to reduce this uncertainty component.
Given the nonlinearity of the maximum pressure model and uncertainties for some input parameter distributions, a Monte Carlo analysis (GUM Supplement 1) was employed accordingly to validate the uncertainty assessment methodology.
 |
Fig. 8 High-pressure generator HPI B630 (left) and generated reference pressure (right). |
 |
Fig. 9 Sensitivity of the tested sensor for each pressure (left) and mean sensitivity and linearity (right). |
 |
Fig. 10 Gain accuracy determination of the charge amplifier (left) and acquisition card (right). |
Measurement uncertainty budget of peak ballistic pressure.
4 Monte-Carlo analysis
In accordance with Supplement 1 of the Guide to the Expression of Uncertainty in Measurement (GUM) [10], the Monte Carlo Method (MCM) was employed to propagate the uncertainties of input quantities by generating a large number of random samples and analyzing the resulting distribution of the output quantities. For this study on the ballistic pressure and velocity of the projectile, the LNE-MCM 1.1 software was used to validate the results obtained through the conventional GUM approach, following the verification criteria specified in GUM Supplement 1 [11,22].
According to GUM Supplement 1, the validity of the GUM uncertainty framework by MCM is based on the comparison of the coverage intervals within the limits of stipulated numerical tolerance ( ) [10]. Specifically, if both dlow and dhigh given by Equation (8) are not larger than δ, the GUM uncertainty framework is validated.
 (8)
(8)
where ylow and yhigh represent the lower and upper limits of the Monte Carlo coverage interval.
Furthermore, this software was utilized to establish uncertainties budget by performing a sensitivity analysis using two techniques: Spearman's rank correlation coefficients and Sobol's indices. The probabilistic behavior of the output quantities (pressure and velocity) was assessed by testing their fit to various theoretical distributions using the Kolmogorov-Smirnov test.
By applying the law of propagation of uncertainties through Monte-Carlo analysis on the projectile velocity, the following results presented in Table 6 and Figure 11 are obtained by generating 106 random samples.
The results indicate that the GUM method based on LPU for the uncertainty evaluation of the projectile velocity defined by equation (4) is validated by Monte Carlo analysis. The observed deviations are in accordance with the validity criteria indicated in Supplement 1 of the GUM illustrated in Equation (8). Indeed, the values of dlow (0.02 m/s) and dhigh (0.03 m/s) remain within the computed tolerance limit (δ = 0.05 m/s).
However, the difference in the combined uncertainty observed between the two methods (LPU and MCM), even if only minimal, could be due to a potential weak non-linear correlation between the different sources of errors impacting the variation of the input quantities.
Furthermore, quantitative sensitivity analysis demonstrated that distance variations in projectile velocity measurements constitute the primary uncertainty source. Likewise, the normality of the projectile velocity distribution was statistically verified using the Kolmogorov-Smirnov test (α = 0.05). The test yielded a p-value of 0.4042 (D = 0.028, n = 1500) which confirms that the output quantity follows a normal distribution within a 95% confidence interval, validating its suitability for Gaussian-based uncertainty analysis methods.
Similarly, a Monte Carlo analysis was conducted for ballistic peak pressure uncertainty quantification. Using 106 randomly generated samples, the results presented in Table 7 and Figure 12 demonstrate sufficient concordance between the conventional GUM uncertainty framework and the Monte Carlo simulation outputs.
The results reveal that the MCM approved the LPU method for the evaluation of peak pressure uncertainty based on a first-order Taylor series approximation. Indeed, the values of dlow (0.2 MPa) and dhigh (0.2 MPa) remain within the computed tolerance limit (δ = 0.5 MPa).
Moreover, the Monte Carlo analysis demonstrated that the pressure model illustrated by equation (3) exhibits more significant nonlinearity which is probably due to the existence of a potential correlation between the input values as well as possible lack of precision on their distributions. The statistical analysis using the Kolmogorov-Smirnov test confirms that ballistic pressure variations are optimally characterized by a normal distribution.
The sensitivity of the piezoelectric transducer and the gain of the charge amplifier have a significant impact on the uncertainty of peak pressure measurements, which is understandable given their roles in the measurement chain.
Results of Monte-Carlo analysis of the projectile velocity by LNE-MCM.
Results of Monte-Carlo analysis of the Pressure by LNE-MCM.
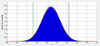 |
Fig. 11 Monte Carlo Analysis of the projectile velocity by LNE-MCM: GUM (green color) and MCM (blue color). |
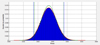 |
Fig. 12 Monte Carlo Analysis of the peak pressure by LNE-MCM: GUM (green color) and MCM (blue color). |
5 Conclusion
This study presents a practical and comprehensive approach to evaluate measurement uncertainties in ballistic peak pressure and projectile velocity by combining the GUM framework with the Monte Carlo Method (MCM). First, the measurement setup was described in detail and all potential error sources in peak pressure and velocity measurements within the ballistics laboratory environment were systematically identified. The GUM method was then applied to determine the uncertainty budgets. Finally, the validity of these uncertainties assessment according to the Law of Propagation of Uncertainty (LPU) was verified using the MCM in compliance with Supplement 1 of the GUM. The required simulations were carried out using the LNE-MCM software.
The strong agreement observed between the two methods confirms the reliability of the uncertainty evaluations methodology for the projectile velocity and peak pressure, with deviations remaining within the acceptable limits. The Monte Carlo analysis has enhanced the uncertainty assessment in projectile velocity and peak pressure measurements and approved the GUM uncertainty framework using LPU. Given the non-linear nature of the mathematical models used for these ballistic quantities, the Monte Carlo analysis proved essential for validating the GUM approach, which is typically applied to linear models.
Certain uncertainty sources, such as the dynamic response of the piezoelectric pressure sensor and variations in barrel temperature, remain difficult to quantify precisely. These uncertainties were estimated based on prior sensor characterization data. Additionally, it was found that the accuracy of the distance between the optical light screens and their geometric alignment significantly affected the accuracy of the projectile velocity measurements, emphasizing the importance of a precise experimental setup to obtain reliable results.
Acknowledgments
The authors would like to express their deep appreciation to the staff of the ballistics laboratory of the ammunition factory for their practical advice and feedback which helped to further consolidate the results illustrated in this article.
Funding
This research received no external funding.
Conflicts of interest
The authors assure that there is no conflict of interest related to the content of this article.
Data availability statement
This article has no associated data.
Author contribution statement
All authors contributed to writing, reviewing, and editing the article.
References
- D.E. Carlucci, S.S. Jacobson, Ballistics: Theory and Design of Guns and Ammunition (CRC Press: Boca Raton, FL, 2018) [Google Scholar]
- L. Elkarous, M. Pirlot, J.-C. Golinval, M. Maldague, Investigation on gas pressure measurement inside small caliber weapons with piezoelectric transducers, in Proceedings of the Measurement Science Conference 2012, Anaheim, CA, USA, 25–28 March 2011 (2011) [Google Scholar]
- B.A. Parate, H. Shekhar, S. Chandel, A novel method for dynamic pressure and velocity measurement related to a power cartridge using a velocity test rig for water-jet disruptor applications, Central Eur. J. Energ. Mater. 16, 319–342 (2019) [Google Scholar]
- B.A. Parate, S. Chandel, H. Shekhar, An experimental and numerical approach – characterization of power cartridge for water-jet application, Defence Technol. 14, 683–690 (2018) [Google Scholar]
- B.P. Kneubuehl, Ballistics: Theory and Practice (Springer Berlin, Heidelberg, 2024) [Google Scholar]
- North Atlantic Treaty Organization, NATO STANDARD AEP-97: Multi-Calibre Manual of Proof and Inspection (M-CMOPI) for NATO Small Arms Ammunition (North Atlantic Treaty Organization, Brussel, Belgium, 2020) [Google Scholar]
- North Atlantic Treaty Organization, NATO STANAG 4823: Multi-Calibre Manual of Proof and Inspection (M-CMOPI) for Nato Small Arms Ammunition (North Atlantic Treaty Organization, Brussel, Belgium, 2020) [Google Scholar]
- N.G. Paulter, Measurement uncertainty of bullet velocities that are acquired with light screens and a waveform recorder, J. Testing Evaluat. 51, 4567–4574 (2023) [Google Scholar]
- BIPM, JCGM 100: Evaluation of measurement data — Guide to the expression of uncertainty in measurement (GUM), 2008 [Google Scholar]
- BIPM, JCGM 101: Evaluation of measurement data — Supplement 1 to the “Guide to the expression of uncertainty in measurement” - Propagation of distributions using a Monte Carlo method, 2008 [Google Scholar]
- Laboratoire national de métrologie et d'essais (LNE), LNE-MCM: Software for evaluating measurement uncertainties using the Monte Carlo Method, www.lne.fr, last access 02/04/2025. [Google Scholar]
- L. Elkarous, C. Robbe, M. Pirlot, J.-C. Golinval, Dynamic calibration of piezoelectric transducers for ballistic high-pressure measurement, Int. J. Metrol. Qual. Eng. 7, 201 (2016) [Google Scholar]
- L. Elkarous, A. Nasri, R. Nasri, Numerical modeling and analysis of the pressure pulses generator for the dynamic calibration of high-pressure transducers. Appl. Acoust. 147, 56–63 (2019) [Google Scholar]
- Kistler Instrument Corporation, Defining Parameters for Ballistic High-Pressure Sensors, Transducer Workshop June 20-21, 2000, Aberdeen, MD, USA. [Google Scholar]
- J. Salminen, R. Högström, S. Saxholm, A. Lakka, K. Riski, M. Heinonen, Development of a primary standard for dynamic pressure based on drop weight method covering a range of 10 MPa–400 MPa, Metrologia 55, S52 (2018) [Google Scholar]
- C.B.C. Felix, K.A.R. Medeiros, C.R.H. Barbosa, Comparison of pressure measurement methods used in ballistics tests, Measurement: Sensors 38, 101694 (2024) [Google Scholar]
- C.B.C. Felix, K.A.R. Medeiros, C.R.H. Barbosa, Metrological analysis of procedures established in the current standards applicable to the calibration of piezoelectric transducers used in ammunition pressure tests, Measurement 242, 115825 (2024) [Google Scholar]
- R. Högström, A. Lakka, J. Hämäläinen, L. Salonen, A. Brzozowski, Novel primary standard for dynamic pressure up to 500 MPa, Measurement: Sensors 38, 101686 (2025) [Google Scholar]
- R. Vitek, Analyses of the measurement accuracy of the optical light gates, in International Conference on Military Technologies (ICMT 2019), May 30 – 31, 2019, Brno, Czech Republic (2019). https://doi.org/10.1109/miltechs.2019.8870114 [Google Scholar]
- High Pressure Instrumentation (HPI), Operating instructions: B216 DR-Data Recorder, 2013, Graz, Austria [Google Scholar]
- High Pressure Instrumentation (HPI), Operating instructions: B472 Precision Light Screen, 2009, Graz, Austria [Google Scholar]
- G. Ebrard, A. Allard, N. Fischer, A user-friendly software for a simple and validated implementation of GUM Supplement 1, in 17th International Congress of Metrology (2015). https://doi.org/10.1051/metrology/20150002012 [Google Scholar]
Cite this article as: Lamine Elkarous, Mohamed Dhouibi, Oussama Atoui, Khalil Mansouri, Assessment of uncertainties in pressure and velocity measurements in ballistics using piezoelectric transducers and light screens, Int. J. Metrol. Qual. Eng. 17, 9 (2026), https://doi.org/10.1051/ijmqe/2026005
All Tables
All Figures
|
Fig. 1 Gas pressure and projectile velocity measurement according to EPVAT technical specifications [17]. |
| In the text | |
|
Fig. 2 Pressure transducers mounted in the barrel. |
| In the text | |
|
Fig. 3 Simplified equivalent electrical circuit for piezoelectric transducer, cable and charge amplifier. |
| In the text | |
 |
Fig. 4 Signal processing by the B472-TR time record [21]. |
| In the text | |
|
Fig. 5 Peak pressure of NATO SS109 for 30 rounds. |
| In the text | |
|
Fig. 6 Projectile velocity of NATO SS109 for 30 rounds. |
| In the text | |
|
Fig. 7 Case mouth and port pressure measurement. |
| In the text | |
|
Fig. 8 High-pressure generator HPI B630 (left) and generated reference pressure (right). |
| In the text | |
|
Fig. 9 Sensitivity of the tested sensor for each pressure (left) and mean sensitivity and linearity (right). |
| In the text | |
|
Fig. 10 Gain accuracy determination of the charge amplifier (left) and acquisition card (right). |
| In the text | |
|
Fig. 11 Monte Carlo Analysis of the projectile velocity by LNE-MCM: GUM (green color) and MCM (blue color). |
| In the text | |
|
Fig. 12 Monte Carlo Analysis of the peak pressure by LNE-MCM: GUM (green color) and MCM (blue color). |
| In the text | |
Current usage metrics show cumulative count of Article Views (full-text article views including HTML views, PDF and ePub downloads, according to the available data) and Abstracts Views on Vision4Press platform.
Data correspond to usage on the plateform after 2015. The current usage metrics is available 48-96 hours after online publication and is updated daily on week days.
Initial download of the metrics may take a while.