Fig. 2
Download original image
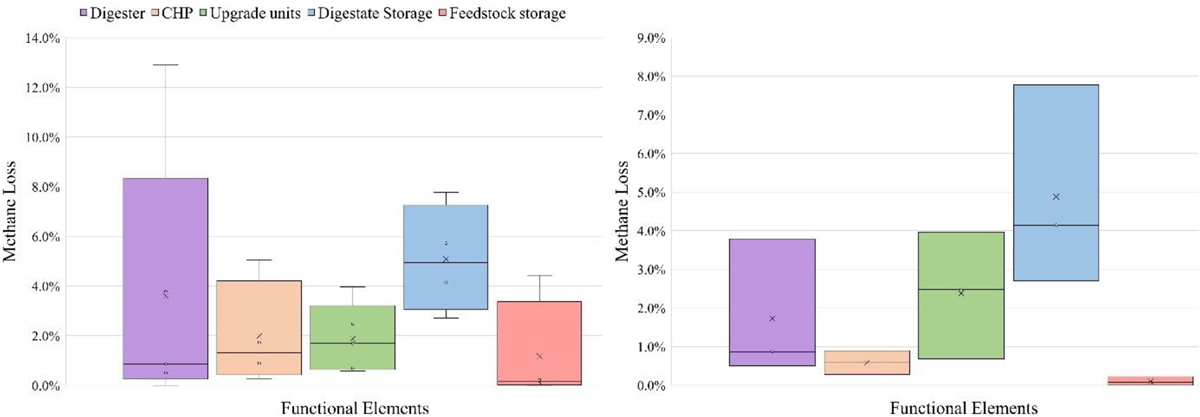
Methane loss comparison. Left panel: summary box-whisker plots highlighting the range in methane emission factors (%) from indicated functional elements. Right panel: summary box-whisker plots highlighting the range in methane emission factors (%) from various functional elements for site which utilized agriculture feedstocks. Bars left to right with corresponding colours: purple - Digester, yellow - cogeneration system of heat and power (CHP), green - upgrade units, blue - digestate storage, orange - feedstock storage.
Current usage metrics show cumulative count of Article Views (full-text article views including HTML views, PDF and ePub downloads, according to the available data) and Abstracts Views on Vision4Press platform.
Data correspond to usage on the plateform after 2015. The current usage metrics is available 48-96 hours after online publication and is updated daily on week days.
Initial download of the metrics may take a while.