| Issue |
Int. J. Metrol. Qual. Eng.
Volume 12, 2021
Topical Issue - Advances in Metrology and Quality Engineering
|
|
|---|---|---|
| Article Number | 26 | |
| Number of page(s) | 10 | |
| DOI | https://doi.org/10.1051/ijmqe/2021024 | |
| Published online | 08 December 2021 | |
Research article
UML knowledge model for measurement process including uncertainty of measurement
1
Brunel University London, Uxbridge, UK
2
National Physical Laboratory, Teddington, UK
* Corresponding author: This email address is being protected from spambots. You need JavaScript enabled to view it.
Received:
31
March
2021
Received in final form:
2
August
2021
Accepted:
18
October
2021
Abstract
Measurement technology has made an enormous progress in the last decade. With the advent of knowledge representation, various object-oriented models for measurement systems have been developed in the past. Most common limitations of all these models were not incorporating the uncertainty in the measurement process. In this paper, we proposed an object-oriented model depicting the information and knowledge flow in the measurement process, including the measurement uncertainty. The model has three major object classes, namely measurement planning, measurement system and analysis & documentation. These are further classified into sub-classes and relationships amongst them. Attributes and operations are also defined within the classes. This gives a practical and conceptual view of knowledge in the form of object-model for measurement processes. A case study is presented which evaluates the uncertainty of the measurement of a 100 mm gauge block, using both Type A and Type B evaluation methods of the GUM approach.This case study is very similar to the evaluation of calibration uncertainty of CMM. This model can be converted into semantic knowledge representation such as ontology of measurement process domain. Other use of this model is to support the quality engineering in manufacturing industry and research.
Key words: UML / measurement system / knowledge representation / uncertainty of measurement / ontology / calibration
© P. Bharti et al., Published by EDP Sciences, 2021
 This is an Open Access article distributed under the terms of the Creative Commons Attribution License (https://creativecommons.org/licenses/by/4.0), which permits unrestricted use, distribution, and reproduction in any medium, provided the original work is properly cited.
1 Introduction
Many attempts have been made in the past to develop a data model for measurement systems in metrology. These models include visual, analytical, and linguistic representations. Initially, most of the data modelling for the measurement system describes the crucial features with related information diminishing its complexity. A sophisticated and consistent data model provides a unified and systematic view of information flow at the first level of data modelling. An organized flow of information also encourages knowledge representation of the complex model systematically. Knowledge representation helps to extract the relevant knowledge from a precise data model by inference rules and designing an application model for that knowledge. This data model defines concepts and relationship of measurement system for the ontology development. Ontology development is an extended effort of this work. Object-oriented models have been developed in earlier works to understand the systematic operations of measurement systems [1]. But these models did not take measurement uncertainty into account. Uncertainty is a quantification of the doubt about the measurement result. To evaluate the measurement uncertainty, it is important to understand the various sources of uncertainty. This paper presents a knowledge representation model about information flow in the measurement system that includes an essential part of the measurement process: uncertainty of measurement results. The model covers the different stages of the measurement process using a coordinate measuring machine (CMM) as an example, together with a case study of an measurement of a 100 mm gauge block using the CMM and its uncertainty evaluation using the GUM approach. The proposed knowledge representation model and methodology may be applied in various measurement processes of CMMs and other measurement systems, including measurement and calibration processes.
This paper is organised as follows. Section 2 presents a proposed knowledge representation model for the measurement system. Section 3 presents a case study of the proposed knowledge representation model by evaluating the uncertainty of a 100 mm gauge block using the GUM approach [2]. Section 4 discusses the applications of the proposed knowledge representation model and highlights contributions made. Finally, Section 5 provides some concluding remarks.
2 Knowledge representation for measurement system
The concept of knowledge can be illustrated in Figure 1. We have the data in the unstructured form [3]. Context independent data is known as unstructured data. Knowledge depends on the refinement of data and information. The knowledge is context-dependent and has a pattern of information. This data transforms into a domain or context-specific data by refining the information to knowledge. To make the decisions, we need to establish the relationship between the concepts or information used in a domain. There should be some formal or graphical representation of concepts and the relationships among them, including constraints. This is called knowledge representation of a particular domain. Knowledge representation plays a vital role in enabling the re-usability and sharing the domain knowledge.
Yang et al. [4] proposed a knowledge pyramid with three-level abstractions. At the first level of abstraction, properties or attributes and their relationships are developed through experiences and human perception of external objects and phenomena in real world. The second level represents the conversion of the properties or characteristics (i.e., measurand) into a suitable symbolic form that could be machine-readable. In the third level of abstraction, the information generated by the machines should be extracted to capture the knowledge. Deductive reasoning and data manipulation can analyze this information. In manufacturing industry, the performance is based on three key factors: customer's desired quality, reduced production cost, and cycle time [5]. The organized use of the knowledge in industry and new knowledge standards are essential to achieve these goals. The manufacturing industry uses measurement systems to support the design and manufacture of the physical components. There has been an increasing need to share and reuse the information and knowledge related to the measurement processes in manufacturing industry, particularly in Industry 4.0. This knowledge representation will underpin the future applications of advanced measurement systems in manufacturing industry.
 |
Fig. 1 Transformation of data to domain knowledge. |
2.1 Importance of uncertainty
While proclaiming the result of a measurable quantity, it is vital to provide the measured quantity value along with its uncertainty to help the user to gain better understanding of the measurement. The notion of uncertainty in the measurement system is broad and is traditionally related to the common practice of error analysis. Even if the errors are analyzed and the associated corrections are made, there is still uncertainty in the measurement results. Uncertainty is increasingly regarded as an important concept in metrology. It may be generally understood as the “doubt” about the outcome of the measurement, whilst the VIM [6] has defined measurement uncertainty as the parameter characterizing the dispersion of the quantity values being attributed to a measurand, based on the information used. The GUM [7] describes the general concept of uncertainty and its quantitative measures, and it further provides the guidance on the evaluation of uncertainty in measurement processes.
The quality of measurement and results depends on the measurement uncertainty. As such, measurement uncertainty is an essential piece of information in metrology and manufacturing. For example measurement uncertainty must be reported on a calibration certificate, and considered when determining a pass or fail in a test, or deciding if the manufacturing tolerance is met [8].
2.2 Proposed knowledge model for measurement system
The use of object-oriented modelling language started in 1970s. The Unified Modelling Language (UML) was first developed in 1994 by Rumbaugh [9]. The collaboration of various companies such as Microsoft, Oracle, IBM, etc., initiated the concept of UML 1.0, which is very sophisticated, powerful and applicable to an extensive range of problem domains. UML is maintained by Object Management Group (OMG). An object-oriented model represents the blueprint of a system and it gives the real and visual representation of the behavior of a system. There are several views of the model depending upon the application, such as process view, design view, implementation view, etc. UML considers construction, visualization and documentation of object-oriented models. The object-oriented modelling enables identification and communication of the objects and allows data abstraction, inheritance and encapsulation. UML diagrams are pictorial representation of classes, objects and relationships between them. There are many tools available to design UML, such as Start UML, Agro UML, etc. The draw.io, an open-source (by Google) tool, has been used to develop our object-oriented diagrams, following UML 2.5.1 version.
An object-oriented model of measurement systems has been previously developed in [1], but the model does not directly include the uncertainty of measurement. The proposed new model has significantly extended the object-oriented model in [1], explicitly addressing the data flow of measurement results and uncertainty in the measurement process.
Figure 2 represents a high level view of information flow in a typical measurement process. This model facilitates the study of information flow and relationships among various classes and subclasses in the measurement system. The measurement process consists of three major classes: Measurement Planning, Measurement System and Analysis Documentation. The idea of these classes is given by National Institute of Standards and Technology that defines measurement processes for manufacturing systems [10]. Figure 2 shows that during a measurement process, the planning generates the measurement plans for the measuring system. Given the measurement plans, the measuring system produces the measurement data that are further processed in the analysis and documentation phase. The measurement planning and analysis documentation phases can share reports to improve measurement and analysis, leading to further accuracy enhancement. Thus, the proposed measurement process model illustrates the key stages of a typical measurement process, but it is essential to capture the detailed knowledge to elaborate this model further with additional classes. These primary classes can be subdivided into subclasses, with their interrelationships also established. We discuss each stage of the object oriented model in the following subsections.
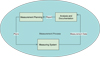 |
Fig. 2 Abstract view of information flow model for measurement processes. |
2.2.1 Stage 1: Measurement planning
The first phase of measurement process is measurement planning. Figure 3 illustrates the division of the measurement planning class into subclasses. The rectangle boxes show classes which is divided in three parts, with the class name displayed in the top, the class attributes in the middle, and the class operations in the bottom. The model makes use of three types of relationships. Generalization/inheritance is shown as a line with a hollow triangle as the arrowhead pointing to the parent class, which means the child class inherits its parent class properties. Association is depicted with solid lines representing the roles such as “calibratedBy” or “measuredBy”. Aggregation is shown with a hollow diamond head towards the aggregated class, expressing the relations “Part-Of” or “consistOf”. The association and aggregation relations may have multiplicity to specify the allowable number of instances, where the notation * means zero or more instances and “1” shows exactly one instance of the class is associated with the instance of another class.
Figure 3 shows that the “Measurement Planning” has three subclasses, “Measurement Task (MT)”, “Measured Features (MF)” and “Measurement strategy (MS)”. The Measurement Planning class's main attributes are based on the selection of measuring instrument, artefacts, operator and other elements. The detailed measurement plans are generated as final results for the specific measurement task, MS [11] is a broad task that can be a structured process of questioning and critical thinking. To provide successful measurement, it includes “Measurement Procedure (MP)”, “Measurement Method (MM)” and “Measurement Principle” in its decision process that determines which instrument(s), setup and measurement method are best for the required task to obtain the measurement results.
The class “Measurement Task” specifies the relevant measurement job and requirements. For a coordinate measuring machine (CMM), this may include inspection of a specific workpiece, task related calibration and verification as jobs. This class has the attributes such as type of task, workpiece, specification (e.g., measurement range, tolerances) and other details of the measurement task. MP includes “Measurement Method (MM)” and “Measurement Principle” that can be applied. MM is defined with a specific explanation of operations.
According to VIM 2.6, “MP ” is a detailed description of a measurement according to one or more measurement principles and to a given measurement method, based on a measurement model and including any calculation to obtain a measurement result.VIM 3.2 [12] defines the “Measuring System” as a collection of one or more measuring instruments. Its information is used to produce measured quantity values within specified intervals for quantities of specified kinds. “Measured Features” are the features to be measured, typically including line, circle, cone, plane, sphere, cylinder, etc as shown in Figure 3. Given the Measurement Task, Measured Features can be identified, the Measurement Strategy including suitable measuring instruments and the measurement set up can be determined. The detailed measurement plan as the measurement procedure can then be generated, together with the measured method and measurement system models.
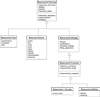 |
Fig. 3 Object Oriented Model for Measurement Planning. |
2.2.2 Stage 2: Measurement system
The second phase of measurement process is “Measurement System”. “Measuring System” is shown in Figure 4, with “Measured Object”, “Measuring Instrument” and “Measurement Result” as the subclasses of the measurement system. When the measurement plan is generated, the measurement system will carry out the measurement of the measured object. The artefact class has two sub-classes, “Measured object” and “Reference Artefact” and an associated class called “Geometric Element”. Artefact has various geometric elements (or features) defined in the class diagram. Measured object has unknown quantity values, while the Reference Artefact has been calibrated with known quantity values. The CMM is shown by the relation “calibratedBy” with Reference Artefact.
“Measuring Instrument” has CMM as an instance with its attributes such as configuration etc. An association “measuredBy” has shown multiplicity between “Artefact” and “CMM”, which means at least one CMM measures one or more Artefacts. The attributes of Measurement Results are also given in the class diagram, such as units, errors, uncertainty, etc.
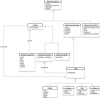 |
Fig. 4 Object Oriented Model for Measuring System. |
2.2.3 Stage 3: Analysis and documentation
The final phase of measurement process is “Analysis and Documentation”. Figure 5 shows the class of “Analysis & Documentation”, which is more specific to analysis of the results, uncertainty evaluation and documentation. “Measurement Results”, “Measurement Uncertainty”, and “Uncertainty Budget” are a subclass of this class. Measurement Uncertainty is further divided into four subclasses as Sources, Measurement model, Uncertainty Expression and Evaluation Methods. Sources class has attributes that are contributing to the measurement uncertainty. The “Measurement Model” is a mathematical relation of all quantities which contribute to the measurement, and the output quantity is named as measurand [6].
In [6], the quality of “measurement result” can be expressed in quantitative indication given by “measurement uncertainty”. The measurement result contributes to the measurement uncertainty because its values depend on the influnced quantities due to devices, calibration and reference material, etc. There is an association “hasUncertainty” between the “Measurement Uncertainty” class and “Measurement result” class. The class “Uncertainty Expression” may be denoted in various ways, such as standard deviations or a confidence interval. The GUM states that uncertainty estimates should be presented as standard measurement uncertainty. The subclass “Combined Uncertainty” is calculated by combining the Standard Uncertainties of all the input quantities. The Expanded Uncertainty is obtained by multiplying the “Combined Uncertainty” with a coverage factor. “Evaluation Methods” is linked to “Standard Uncertainty” by “evaluatedBy” which means Standard Uncertainty is evaluated by “Type A” and “Type B” methods. “Uncertainty Budget” has a simple unidirectional association “summarised By” with the “Measurement Uncertainty”.
The “Uncertainty Budget” has all the information related to measurement uncertainties such as uncertainty sources, distributions, sensitivity coefficients and degree of freedoms, etc. It contains all analyzed information during the measurement uncertainty evaluation process. The description of these terms can be found in Barwick et al. [12]. This class produces an “Uncertainty Budget” and reports it to the “Measurement Planning” class.
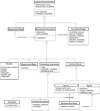 |
Fig. 5 Object Oriented Model for Analysis and Documentation. |
3 Case study: Gauge block length measurement using a CMM
In this example, a nominal 100 mm gauge block has been measured by a Mitutoyo CMM in the Metrology Lab at Brunel University London. This case study evaluates the uncertainty of the measurement of the 100 mm gauge block, using both Type A and Type B evaluation methods of the GUM approach [2]. Type A uncertainty evaluates the repeatability of the measurement process. Standard deviations of repeated results determine this uncertainty estimate. The International Vocabulary of Metrology (VIM) defines Type B uncertainty as the evaluation of a component of measurement uncertainty by a method other than a Type A evaluation.
3.1 Tasks
The main tasks of this case study are given as follows:
Define different uncertainty components into two types of evaluation: (i) Type A (based on a series of observations using a t-distribution); (ii) Type B (evaluated using available information).
Evaluate the standard, combined, and expanded uncertainty.
Generate the uncertainty budget report.
Express the uncertainty statement.
3.2 Steps
In “Measurement Planning” as shown in Figure 3, “Measurement Task” can be described as “to measure the length of 100 mm gauge block using a CMM”. The “Measured Feature” include the two planes (end faces) and the characteristic is the distance between the planes. The mathematical model [13] can be defined by the class “Measurement System Model” as: (1)
(1)
where Lb is the length of the gauge block at 20 °C, Lc is the length of the gauge block measured by the CMM, αc is the coefficient of thermal expansion of CMM scale, αb is the coefficient of thermal expansion of gauge block bar, ΔTc is the temperature deviation of CMM scale from 20 °C during measurement process, and ΔTb is the temperature deviation of the gauge block bar from 20 °C during measurement process. According to [14], the measurement strategy consists of several tasks such as selection of features on workpiece, workpiece orientation, workpiece holding method, stylus system configuration and probing strategy.
In this case study, the class “Measurement Strategy “specifies the qualification of the probe by calibrating around the reference sphere before starting the measurement procedure. It selects an appropriate stylus strategy from the CMM program and manually inserts it into the probe. It also instructs the user to define the part coordinate system on the gauge block. For all the repeated measurements, there is a single Workpiece Setup that can be accessed under the software's CMM repeat mode.
The “Measurement Procedure” class decides that probe measures 4 points on each end face of the gauge block. The planes and distance measurements are programmed and then repeated ten times automatically. The measurement data can be exported in a PDF format, which can be converted to an MS Excel spreadsheet for analysis purposes. For the evaluation of the measurement result, the above measurement model in equation (1) has been used.
The direct method is used as the “Measurement” Method for the length measurement by first measuring the points on the two end faces and then calculating the distance between them. The “Measurement Principle” in this case study is based on the surface digitization with a contacting trigger probe.
The superclass “Measuring System” in Figure 4 specified the “Measured Object” as 100 mm gauge block which has planes as “Geometric Features”, with the Mitutoyo CMM (CRYSTA-APEX-S544) as “Measuring instrument”. The subclass of CMM “Probe” is Renishaw probe (SP25), together with the X-axis, Y-axis and Z-axis (range: 505 × 405 × 405 mm). Ten readings are measured on both planes of the gauge block using the CMM. The perpendicular distance between these two planes are then calculated. The “Measurement Result” is therefore the mean of ten perpendicular distances (i.e., the estimated average length of a bar measured by CMM). This result contains measurement uncertainties and this can be calculated in class “Analysis & Documentation”. For this case study, the key “uncertainty sources” are repeatability and CMM calibration, which are assessed using the Type A and Type B “Evaluation methods” of the GUM approach, respectively.
3.3 Uncertainty budget
The detailed summary of elements that contribute to the uncertainty in measurement outcomes is known as an uncertainty budget. It displays crucial data that classifies, quantifies, and describes every uncertainty source. An uncertainty budget's purpose is to use a well-organized, systematic method to calculate the measurement uncertainty. The advantage of this is that it provides the analyst with a formal record of the evaluation process that can be shared with other people. The “Uncertainty Budget” has been produced in a form of uncertainty budget table (see Tab. 1) after calculating the “Standard Uncertainty” (first six sources of uncertainties), the “Combined Uncertainty” and the “Expanded Uncertainty”. As part of this case study, the mean measurement result has been calculated using the “Measurement Model” and the uncertainty has been expressed as “Uncertainty Expression”.
Uncertainty Budget for 100 mm steel gauge block using the GUM approach.
3.3.1 Uncertainty of the measured length u(Lc2)
From the ten repeated measurements (N = 10) taken of the length 99.908, 100.082, 99.827, 99.899, 100.066, 100.107, 100.218, 100.281, 100.104 and 99.955 mm, the mean measured length of the steel gauge block was Lc = 100.04473 mm with a standard deviation of σ = 0.14555 mm. Therefore, the standard uncertainty of the repeatability of the CMM reading is  mm, with degrees of freedom
  . Based on the performance verification report on the CMM provided by Mitutoyo [13], the measurement uncertainty of the machine using a SP25M probe is
  mm, which implies that
  , with degrees of freedom
  (assumed to be from a normal distribution).
Hence, the uncertainty of the measured length is  , with degrees of freedom ν (Lc) equal to:
3.3.2 Other type B uncertainty calculations
Type A and B uncertainties are reflected in CMM measurement repeatability readings  and performance verification reports
  , respectively. The following will present the calculations of four additional Type B uncertainty sources in equation (1), namely αc, ΔTc, αb and ΔTb, which are each associated with a rectangular distribution and degrees of freedom equal to ∞.
The coefficient of thermal expansion of CMM scale is known to be 5 × 10⁻⁶/° C and has a standard uncertainty of
 .
.The temperature deviation on the CMM scale (and the workpiece) was reported to be 20.2 ° C, with the standard uncertainty being given as
 .
.The coefficient of thermal expansion of the steel gauge block is 11.5 × 10⁻⁶/° C and is estimated to have a standard uncertainty of
 /° C [16].
3.3.3 Sensitivity coefficients
The sensitivity coefficient values c(xi) are necessary in the computation of the combined uncertainty uc and expanded uncertainty U such that  and U = kuc, where k is the coverage factor. According to [13], the sensitivity coefficients are calculated by taking the partial derivative of Lb in equation (1) with respect to each parameter (e.g., c (Lc) = ∂ Lb/∂ Lc, c (αc) = ∂ Lb/∂ αc, etc). Thus,
3.3.4 Uncertainty budget table and results
Using the results in the previous subsections, we find that the mean measured length of the steel gauge block at 20 °C is 100.04479 mm, with associated combined and expanded uncertainties of 0.065094 mm and 0.130189 mm, respectively, assuming a coverage factor of k = 2. Table 1 presents the uncertainty budget and summarises the results for the 100 mm steel gauge block. The effective degrees of freedom for the combined uncertainty is calculated using.

4 Discussions and applications
The UML, maintained by a Standard Object Management Group (OMG), has been widely used in institutions and industries. It is a formal pathway for defining extensions for particular application contexts, such as ontology modeling. Our model represents the higher-level of abstract information flow during a typical measurement process to reuse and share the information for measurement process modelling applications. The proposed model clarifies the domain knowledge for the measurement process in graphical notation, which helps to understand concepts and relationships better for ontology development and can be readily transformed into ontology.
The contribution of this work is based on the modeling and analysis of the measurement system and measurement process. It can play a functional and theoretical role in the research of measurement systems and evaluation of measurement uncertainty. The proposed model can be converted into semantic knowledge such as ontology of measurement process domain. Ontology consists of classes, subclasses and the relationships between classes, with attributes definitions and axioms that are constraints. Ontology knowledge can be incorporated in the object-oriented model in UML and Object Constraint Language (OCL). Examples of UML transformation to ontology are given by [15,16], providing detailed steps to convert the model into semantic knowledge. Our UML model can thus facilitate the development of an ontology for the domain of measurement processes, and it helps understand the flow of information and relationships among ontology concepts of measurement processes. This model can be used to present the measurement process with uncertainty in a well-structured way. The UML model of measurement process can also be used to develop the user interface of search engine software to answer the queries related to the measurement processes.
In order to ensure robustness, calibration requires knowing the uncertainty sources of the gauge block and typically measuring several different lengths of gauge blocks. This paper shows an uncertainty calculation for a steel gauge block of length 100 mm. However, it is important to note that the evaluation of calibration uncertainty for different measurements is very similar to the uncertainty evaluation in this case study.
5 Conclusion
Based on various object-oriented models developed in the past, we have presented a new framework of information flow that models the key classes, sub-classes and associations between different concepts in measurement processes. Our object-oriented model in UML has explicitly incorporated measurement uncertainty in the measurement process. The model can well represent the domain knowledge for measurement processes in graphical notation, thereby can be also used to further develop the ontology of measurement processes. The case study presented in this paper follows the provided UML model, allowing the user to plan and understand the measurement process better. The concepts and model as a tool presented may potentially improve the measurement quality in various industries like manufacturing and aerospace, where continuing efforts are made to minimize the measurement errors and measurement uncertainty.
Conflict of interest
There is no conflict of interest for all the authors.
Acknowledgments
I would like to thank the Brunel University London for funding this research project and providing access to the Mitutoyo CMM.
References
- Q. Yang, C. Butler, An object-oriented model of measurement systems, in IEEE Instrumentation and Measurement Technology Conference Sensing, Processing, Networking. IMTC Proceedings 47, 104–107 (1998) [Google Scholar]
- D. Flack, Good practice guide no. 130: Co-ordinate measuring machine task-specific measurement uncertainties (2013) [Online]. Available: https://www.npl.co.uk/special-pages/guides/gpg130_machine [Google Scholar]
- D.E. Avison, G. Fitzgerald, Information Systems Development: Methodologies, Techniques and Tools McGraw-Hill (2001) [Google Scholar]
- Q. Yang, C. Butler, On framework of measurement science, in Proc. XV IMEKO World Congress (June 1997) (1997) [Google Scholar]
- J.A. Heredia, I.-S. Fan, F. Romero, P. Lowenthal, An approach to knowledge representation and performance measurement for a quality engineering system, IFIP Adv. Inf. Commun. Technol. 154–162 (1996) [Google Scholar]
- Vim − international vocabulary of metrology [Online]. Available: https://www.ceinorme.it/en/normazione-en/vim-en.html [Google Scholar]
- Evaluation of measurement data — guide to the expression of uncertainty in measurement. in: Joint committee for guides in metrology 100 (sept. 2008), pp. 2–51. [Online]. Available: http://www.bipm.org/utils/common/documents/ jcgm/JCGM_100_2008_E.pdf [Google Scholar]
- S. Bell, A beginner's guide to uncertainty of measurement gpg11. [Online]. Available: https://www.npl.co.uk/gpgs/corrosion-control-checklist [Google Scholar]
- G. Booch, J. Rumbaugh, The Unified Modeling Language User Guide, Addison-Wesley (1999) [Google Scholar]
- S.C. Feng, Rule model of feature inspection and resource selection for dimensional measurement planning. [Online]. Available: http://www.innovation4.cn/library/r46616 [Google Scholar]
- N. Marwaha, K. Bevan, Strategic planning for coordinate metrology (2016) [Online]. Available: http://eprintspublications.npl.co.uk/id/eprint/7130 [Google Scholar]
- V. Barwick, E. Prichard, Terminology in analytical measurement: Introduction to vim 3 (2011) [Online]. Available: https://www.eurachem.org/images/stories/Guides/pdf/TAM_2011_Final_web.pdf [Google Scholar]
- T.N.M.C. of the Singapore Productivity and S. Board. Mar. (2019) [Online]. Available: https://www.sac-accreditation.gov.sg/files/documents/laboratory-accreditation/testing-and-calibration-documents/calibration-and-measurement-field/Technical-Guide-1-29-Mar-2019.pdf [Google Scholar]
- D. Flack, Good practice guide no. 41 cmm measurement strategies, (2014) [Online]. Available: https://www.npl.co.uk/special-pages/guides/gpg41_cmm.pdf?ext= [Google Scholar]
- M.H. Vo, Q. Hoang, Transformation of uml class diagram into owl ontology, J. Inf. Telecommun. 4, 1–16 (2019) [Google Scholar]
- S. Cranefield, M. Purvis, Uml as an ontology modelling language, Jan. (1999) [Google Scholar]
Cite this article as: Priyanka Bharti, QingPing Yang, Alistair B. Forbes, Yacine Koucha, UML knowledge model for measurement process including uncertainty of measurement, Int. J. Metrol. Qual. Eng. 12, 26 (2021)
All Tables
All Figures
|
Fig. 1 Transformation of data to domain knowledge. |
| In the text | |
|
Fig. 2 Abstract view of information flow model for measurement processes. |
| In the text | |
|
Fig. 3 Object Oriented Model for Measurement Planning. |
| In the text | |
|
Fig. 4 Object Oriented Model for Measuring System. |
| In the text | |
|
Fig. 5 Object Oriented Model for Analysis and Documentation. |
| In the text | |
Current usage metrics show cumulative count of Article Views (full-text article views including HTML views, PDF and ePub downloads, according to the available data) and Abstracts Views on Vision4Press platform.
Data correspond to usage on the plateform after 2015. The current usage metrics is available 48-96 hours after online publication and is updated daily on week days.
Initial download of the metrics may take a while.