Fig. 1
Download original image
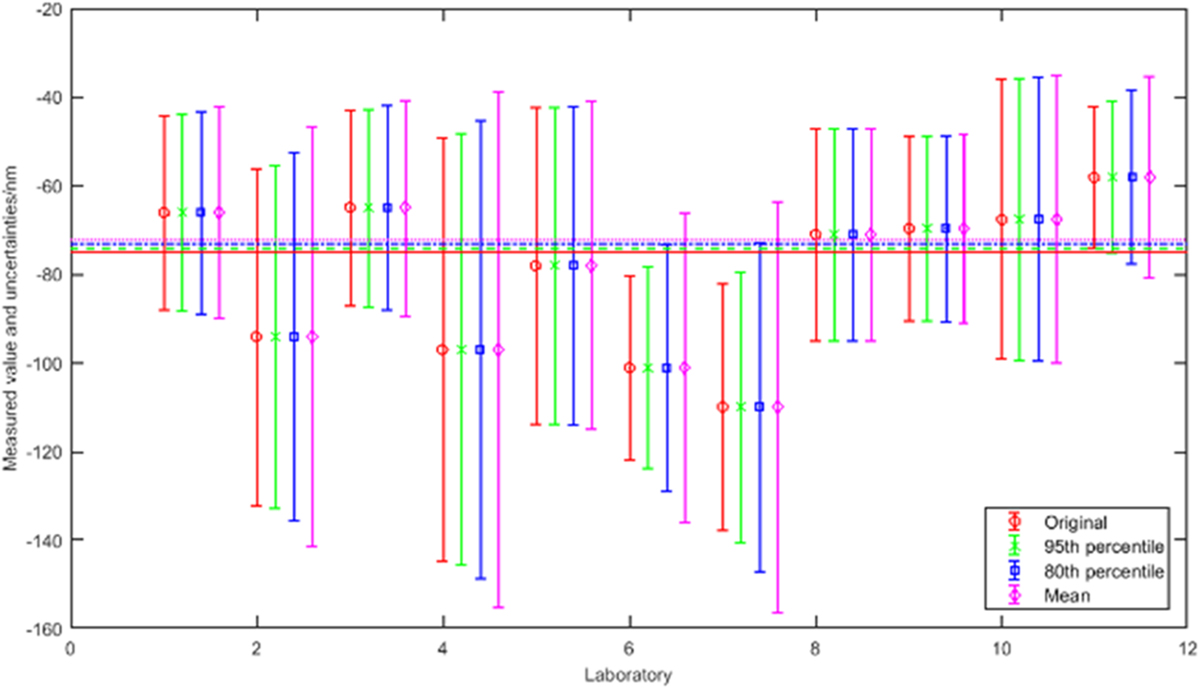
Estimates and 95% confidence intervals of a 100 mm gauge block. The graph shows the uncertainty bars x j ± 2u j for the input uncertainties u 0, the first set of uncertainty bars in each group, and for the adjusted uncertainties based on the relative entropy method u at the 95th percentile, second set, 80th percentile, third set and the mean, fourth set. The horizontal lines are the weighted means determined from the input uncertainties (red solid line), adjusted uncertainties to the 95th percentile (green dashed line), adjusted uncertainties to the 80th percentile (blue dotted and dashed line) and adjusted uncertainties to the mean (magenta dotted line).
Current usage metrics show cumulative count of Article Views (full-text article views including HTML views, PDF and ePub downloads, according to the available data) and Abstracts Views on Vision4Press platform.
Data correspond to usage on the plateform after 2015. The current usage metrics is available 48-96 hours after online publication and is updated daily on week days.
Initial download of the metrics may take a while.