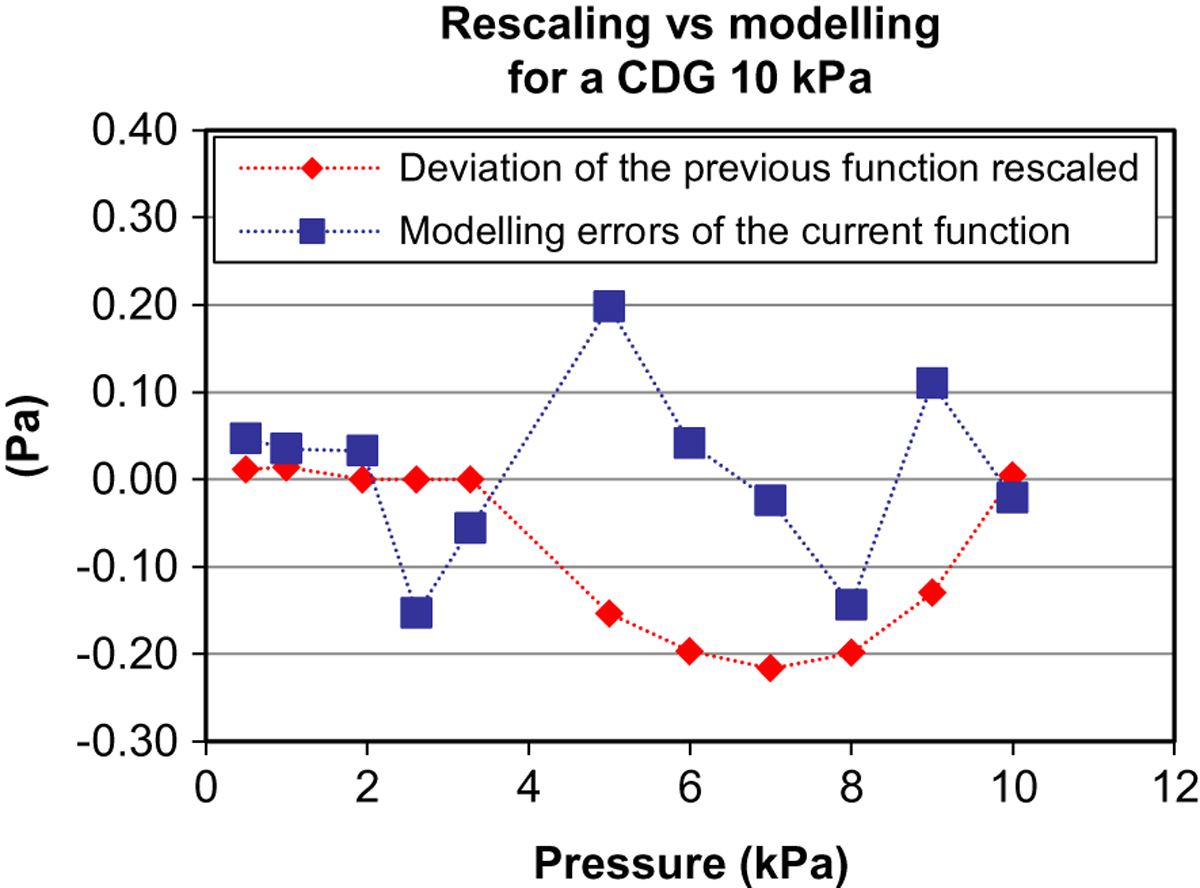
Fig. 6
Download original image
Difference between the calibration function of a 10 kPa full scale CDG obtained in one case by modelling the calibration data (ft), and in the other case by applying a correction factor kCDG to the previous calibration function (kCDG × ft−1). Here kCDG is the slope coefficient of the least squares fit to a straight line that is used to estimate the reference pressure pFPG as a function of the CDG pressure modelled with the function (ft−1), in the range between 40% and 80% of the full scale of the CDG. This difference is plotted together with the residuals of the model: (ft − pFPG).
Current usage metrics show cumulative count of Article Views (full-text article views including HTML views, PDF and ePub downloads, according to the available data) and Abstracts Views on Vision4Press platform.
Data correspond to usage on the plateform after 2015. The current usage metrics is available 48-96 hours after online publication and is updated daily on week days.
Initial download of the metrics may take a while.