Open Access
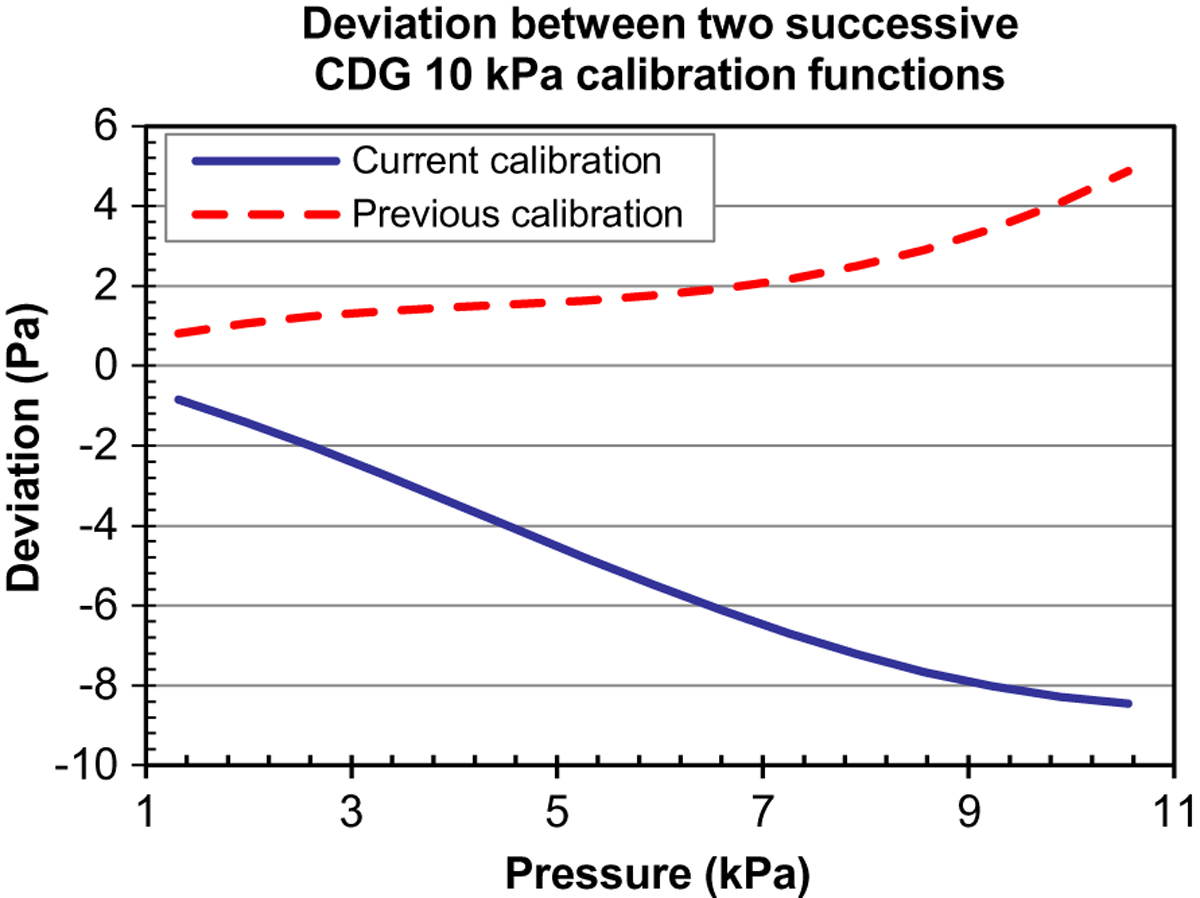
Fig. 5
Download original image
Plot of the deviation of two calibration functions of a CDG 13 kPa full scale, in absolute pressure mode. The two calibrations are spaced by about 12 months. The deviation is the difference between the CDG calibration function and a linear function g(U − U0) = a(U − U0), where a is an arbitrary coefficient.
Current usage metrics show cumulative count of Article Views (full-text article views including HTML views, PDF and ePub downloads, according to the available data) and Abstracts Views on Vision4Press platform.
Data correspond to usage on the plateform after 2015. The current usage metrics is available 48-96 hours after online publication and is updated daily on week days.
Initial download of the metrics may take a while.