| Issue |
Int. J. Metrol. Qual. Eng.
Volume 1, Number 2, 2010
|
|
|---|---|---|
| Page(s) | 105 - 110 | |
| DOI | https://doi.org/10.1051/ijmqe/2010020 | |
| Published online | 17 December 2010 | |
Optimised uncertainty and cost operating characteristics: new tools for conformity assessment. Application to geometrical product control in automobile industry
SP Technical Research Institute of Sweden, Measurement Technology,
Box 857, SE-501 15
Borås,
Sweden
⋆ Correspondence:
This email address is being protected from spambots. You need JavaScript enabled to view it.
Received:
5
August
2010
Accepted:
20
August
2010
Abstract
Translating measurement uncertainty into terms of effective impact associated with
manufacture, testing and incorrect assessment gives a more “stakeholder” motivated (and
ultimately optimised) approach to decision-making in conformance assessment. Recently
developed decision-theory tools include the “optimized uncertainty” methodology and the
“operating cost characteristic”. Overall costs, E, consisting of a sum of
testing costs, D, and the costs, C, associated with
customer risk, can be calculated with the expression: 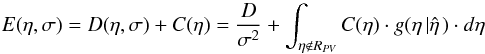 with
with  , where
RPV denotes the region of permissible
values and σ is a measure of dispersion. A complete, 3D surface of
overall cost can indicate the optimum level of measurement effort of these two ranges, as
recently published by the author in a wide range of applications: optimized acceptance
sampling; optimized testing of measurement instruments; and an analysis of optimised
calibration intervals and “guard-banding”. This approach is illustrated in the present
work for the example of geometrical product control in the car industry, specifically the
gap in vehicle closure panels taking account of customer dissatisfaction.
, where
RPV denotes the region of permissible
values and σ is a measure of dispersion. A complete, 3D surface of
overall cost can indicate the optimum level of measurement effort of these two ranges, as
recently published by the author in a wide range of applications: optimized acceptance
sampling; optimized testing of measurement instruments; and an analysis of optimised
calibration intervals and “guard-banding”. This approach is illustrated in the present
work for the example of geometrical product control in the car industry, specifically the
gap in vehicle closure panels taking account of customer dissatisfaction.
Key words: Optimised / uncertainty / cost / GPS / automobile
© EDP Sciences 2010
Current usage metrics show cumulative count of Article Views (full-text article views including HTML views, PDF and ePub downloads, according to the available data) and Abstracts Views on Vision4Press platform.
Data correspond to usage on the plateform after 2015. The current usage metrics is available 48-96 hours after online publication and is updated daily on week days.
Initial download of the metrics may take a while.