| Issue |
Int. J. Metrol. Qual. Eng.
Volume 17, 2026
|
|
|---|---|---|
| Article Number | 7 | |
| Number of page(s) | 12 | |
| DOI | https://doi.org/10.1051/ijmqe/2026003 | |
| Published online | 23 April 2026 | |
Research article
Edge computing-driven distribution routing optimization of emergency medical supplies in smart logistics and smart healthcare systems
Higher Vocational College, Shaanxi University of International Trade & Commerce, Xi'an, 712000, PR China
* Corresponding author: This email address is being protected from spambots. You need JavaScript enabled to view it.
Received:
30
October
2025
Accepted:
2
March
2026
Abstract
This study proposes an edge computing–based dynamic routing optimization framework to address high decision delay and poor adaptability in centralized emergency medical supply distribution during public health emergencies. Such events often cause a 300%–500% surge in medical supply demand, exposing system vulnerabilities. The framework deploys a closed-loop “sensing–prediction–optimization” mechanism at the network edge. A hierarchical analysis method quantifies the dynamic urgency of each demand point as a penalty weight in the optimization objective, while a Transformer–GRU hybrid predictor at edge nodes estimates real-time travel time and demand intensity. A proximal policy optimization (PPO) reinforcement learning algorithm enables low-latency rolling route replanning with heuristic refinement. Simulation results show an F1 score of 0.914 (95% CI [0.892, 0.936]) in on-time delivery discrimination, with an AUC of 0.967 and a top-5 NDCG of 0.934, outperforming baseline models. Compared with centralized architectures, response latency is reduced by 95.29% and weighted tardiness by 48.64%. Task completion remains above 95.5% under 50% congestion and 20% new orders, demonstrating strong robustness and the potential of edge computing and AI for resilient medical logistics systems.
Key words: emergency logistics / edge computing / routing optimization / deep reinforcement learning / smart healthcare
© L. Guo, et al., Published by EDP Sciences, 2026
 This is an Open Access article distributed under the terms of the Creative Commons Attribution License (https://creativecommons.org/licenses/by/4.0), which permits unrestricted use, distribution, and reproduction in any medium, provided the original work is properly cited.
1 Background
In recent years, major public health emergencies have occurred frequently worldwide, posing a serious challenge to human life safety and social and economic stability [1]. The “2023 Global Emergency Preparedness Monitoring Report” by the World Health Organization reveals that the timeliness of medical supply chains is still a critical bottleneck. Logistical delays in some regions have caused significant drops in survival rates and resource utilization during large-scale health crises. In these crisis events, the efficient and accurate distribution of emergency medical supplies is the lifeline to ensure the normal operation of the medical treatment system, control the spread of the situation, and reduce the loss of life and property [2]. From diagnostic reagents, protective equipment to emergency medicines and medical equipment, whether these materials can be delivered to the most needed locations within the “golden window” directly determines the success or failure of the emergency response [3]. The intelligent medical system uses electronic medical records, hospital information systems, and medical Internet of Things (IoT) equipment to sense the real-time consumption rate of materials and the growth trend of each medical unit. The intelligent logistics system uses vehicle-mounted global positioning systems, intelligent warehousing, and advanced traffic monitoring to achieve fine management of capacity and road conditions [4,5]. The research is in line with the strategic requirements of China's “14th Five-Year Plan for Emergency Material Support”. The focus of this plan is on the construction of an intelligent, rapid-response logistics network. This network will achieve high-efficiency distribution and digitalized resource management under extreme conditions.
Existing literature regarding smart logistics and healthcare can be categorized into three dimensions. Regarding technical basic research, studies [6–8] established service maps, IoT-based monitoring paradigms, and authentication protocols. In terms of optimization model innovation, research [9–11] focused on resource allocation in fog computing and stochastic models for disaster-site distribution. Notably, recent studies in the IEEE Internet of Things Journal (2024) have expanded upon edge-cloud collaborative frameworks, enhancing real-time task scheduling in complex logistics networks. For algorithm improvement, various approaches [12–14] utilized improved ant colony, genetic, and game-theoretic algorithms to enhance prediction accuracy and transshipment volume.
In summary, many experts have conducted in-depth research on emergency material demand forecasting and facility siting, as well as routing optimization and supporting technologies such as vehicular network/fog computing. Despite these advancements, a critical research gap persists in addressing the inherent latency bottleneck of centralized decision architectures during public health emergencies. Traditional cloud-centric systems require multi-stage data transmission in the decision pipeline. First, sensor data from vehicles and hospitals is uploaded to remote cloud servers, which typically incurs 50–150 ms of network latency. Next, cloud-side optimization computation occurs, which takes 200–800 ms for large-scale VRP instances. Finally, the decision is disseminated back to edge executors, which takes an additional 50–150 ms. This round-trip delay accumulates to 300–1100 ms per decision cycle, rendering real-time replanning infeasible when road conditions shift abruptly or urgent orders arrive. In medical supply distribution, such delays have tangible clinical consequences. For example, a 5 min delay in making a decision can cause critically ill patients to miss the therapeutic window for sepsis intervention. Delayed delivery of diagnostic reagents during outbreak surges can also exacerbate hospital resource shortages, forcing emergency departments to divert ambulances or ration ICU admissions. Existing research lacks multi-objective collaborative optimization methods that simultaneously integrate clinical urgency quantification, cold chain temperature control, and soft time windows within edge computing paradigms. Furthermore, the "perception-prediction-optimization" closed loop is not sufficiently integrated to translate demand uncertainty into cost-efficient, latency-minimized routing decisions at the network edge. Therefore, the study proposes edge-collaborative emergency medical routing optimization (EC-EMRO): a heuristic to achieve rolling replanning by fusing analytic hierarchy process (AHP) urgency assessment with Transformer/GRU short-time prediction at the edge side, augmented by joint use proximal policy optimization (PPO). It can also support scenarios with limited bandwidth by providing lightweight cross-domain coordination. This allows for fast replanning, integrated modeling of urgency and clinical constraints, and the end-to-end delivery and exploitation of prediction uncertainty. The innovation of the research is to sink the computational intelligence and decision-making capabilities traditionally concentrated in the cloud to the edge of the network, and to build an “perception-prediction-optimization-execution-correction” low-latency decision-making closed-loop on the edge nodes close to the data sources (e.g., hospitals, logistics transit hubs, mobile vehicles). It is expected to provide higher timeliness, fairness and engineering landability for the smart logistics-smart healthcare integration of emergency protection.
The principal innovations of this study are threefold. Theoretical innovation: This research pioneers the deep integration of AHP-based urgency assessment and Transformer-GRU hybrid time-series prediction. This establishes a quantitative mapping from multidimensional clinical indicators to dynamic routing penalties. Technical innovation: An online replanning mechanism with a 1 min edge is achieved by deploying the entire perception-prediction-optimization pipeline at network edges. This reduces decision latency from seconds to milliseconds while maintaining robustness under bandwidth constraints. Methodological innovation: A hybrid optimization strategy is proposed that synergistically combines PPO reinforcement learning with heuristic algorithms. This enables the system to balance exploration efficiency and solution quality in high-dimensional action spaces. These innovations collectively address the critical gap between demand uncertainty perception and cost-efficient routing decisions in emergency medical logistics.
2 Methods and materials
To illustrate the practical implementation, this study considers a representative scenario during a sudden infectious disease outbreak in a metropolitan area. At 08:15, multiple hospitals simultaneously report critical shortages of protective equipment and diagnostic reagents through the smart healthcare system. Edge nodes deployed at regional logistics hubs immediately capture these demand signals along with real-time traffic data from 5G-connected delivery vehicles. Within 87 milliseconds, the edge-based Transformer-GRU predictor estimates that Hospital A requires supplies within 45 min due to imminent ICU overflow, while Hospital B has a 90 min window. The AHP module assigns urgency weights of 0.83 and 0.52 respectively based on patient criticality and inventory depletion rates. The PPO agent then generates optimized routes for three available vehicles, accounting for a traffic congestion zone blocking the direct path to Hospital A. As Vehicle 1 follows its route, an unexpected road closure at 8:42 a.m. triggers an edge-based re-planning process in 63 ms. This reroutes the vehicle through an alternate corridor, ensuring an on-time delivery. This closed-loop process, from demand sensing to adaptive execution, demonstrates how the proposed edge computing architecture translates theoretical innovations into tangible logistics performance under realistic constraints.
2.1 Routing optimization model for emergency medical supplies distribution
In the smart logistics-smart healthcare linkage system, the decision-making of emergency delivery is constructed as a closed-loop of “perception-prediction-optimization-execution-correction”: the vehicle and the hospital site demand, location, temperature control, and road condition data are aggregated in real-time at the edge. The edge node predicts travel time and order arrival on a minute-by-minute basis. Subsequently, the vehicle routing problem (VRP) model with time windows and priorities is solved online at the same node and the results are sent down to the fleet via 5G/V2X. The temperature control and tardiness information of the execution process is then streamed back to trigger rolling replanning [15]. The VRP emergency distribution is shown in Figure 1.
The arrows in Figure 1 indicate the paths and sequences of vehicles starting from the warehouse, serving multiple demand points in sequence, and returning to the warehouse. Under the premise of the given warehouse location and fleet size, taking into account the vehicle capacity and time window constraints, the online planning of the service order of each vehicle and driving routes to minimize the weighted tardiness and transportation costs, forming a closed-loop. The edge nodes update these routes on a rolling basis based on real-time road conditions and new orders. The “optimization” core of this closed-loop is the given routing optimization model. The urgency weights are combined using AHP and fed into the solver as a prioritization factor and a penalty factor for the route decision, so that high-risk and high-uncertainty demands are prioritized [16]. The AHP weight calculation follows a hierarchical decomposition process. First, domain experts construct pairwise comparison matrices for each criterion layer, where element a_jk represents the relative importance of criterion j over criterion k using Saaty's 1–9 scale. The principal eigenvector of this matrix yields preliminary weights, which are then normalized. Consistency is verified through the consistency ratio (CR), computed as CR = CI/RI, where CI is the consistency index and RI is the random index. Only matrices satisfying CR < 0.10 are retained to ensure logical coherence. The study incorporates five primary indicators for demand point urgency assessment: infection case count, supply depletion rate, medical facility capacity utilization, expected service delay, and cold chain criticality. Each indicator is normalized via min-max scaling before weighted aggregation. Time urgency is calculated using AHP weighted and normalized as shown in equation (1).
 (1)
(1)
In equation (1),  is the weight of the indicator obtained by AHP and passed the consistency test.
  is the normalized value of demand point i in indicator j.
  is the demand urgency. The dynamic target is the transportation cost plus urgency-weighted tardiness penalty, as shown in equation (2).
 (2)
(2)
In equation (2),  denotes whether the vehicle k goes from i to j.
  is the unit cost (consisting of road length/energy consumption) of the rolling moment
  .
.  is the soft time window penalty.
  is the unit cost of tardiness.
  is the policy weight. The integration mechanism operates as follows: the AHP-derived urgency weight
  for each demand point i serves as a multiplicative coefficient in the tardiness penalty term. Specifically, when a vehicle arrives at node i beyond its soft time window
 , the penalty magnitude is computed as
  , where higher
  values amplify the cost of delay. This coupling ensures that the optimization algorithm prioritizes routes serving high-urgency demands (e.g., ICU reagent shortages with
  ) over lower-priority deliveries (e.g., routine inventory replenishment with
  ). The data flow progresses sequentially: AHP module outputs urgency weights→weights are embedded into equation (2) as penalty coefficients→PPO agent minimizes the weighted objective→routing decisions reflect clinical prioritization. The dynamic routing optimization process for emergency medical supplies based on AHP and edge computing is shown in Figure 2.
In Figure 2, the model integrates two core modules: a demand urgency assessment for decision prioritization quantification, and a dynamic distribution and real-time replanning execution loop driven by edge computing on this basis. The model is initiated by analyzing the emergency events and available resources, and then the AHP is used to construct the demand urgency assessment system. By selecting key influencing factors such as the number of infected people and the material gap rate, and going through the steps of constructing a pairwise comparison matrix, ranking and consistency testing. The system calculates quantitative demand urgency weights for each demand point. The weights, as key parameters, are fed into the routing optimization algorithm to generate the initial distribution scheme that is sent down to the edge computing node for execution. During the distribution process, the edge node dynamically monitors and collects data from vehicles, road conditions, and demand points. They continuously determine whether there are new contingencies or dynamic demands to trigger the replanning conditions. Once the conditions are triggered, the path replanning task will run directly on the responding edge nodes to realize low-latency path adjustment. The adjusted new path will continue to be executed and monitored [17]. To support the edge-side dynamic replanning and low-latency decision making in Figure 1, the system performs online modeling of time-varying features such as road conditions, vehicles, and cold chains. Key parameters such as travel time and demand intensity are output and backfilled to the routing optimizer in real time. The convolutional neural network-bidirectional gated recurrent unit (CNN-BiGRU) timing prediction module shown in Figure 3 is deployed at each edge node.
In Figure 3, the input sequence  represents the multi-source time-varying observation. First, the local patterns and bursty changes are extracted by 1D convolution, and then downsampled and denoised by pooling layer within a short window to form the context vector Ci at each time step. Subsequently, two GRU links, forward and backward, model Ci on the shared time axis to capture the near and far dependence and causal-inverse causal information. Finally, the corresponding
  is obtained at the output layer.
  is mapped to the key parameters required for the routing optimization model. The transportation cost, tardiness penalty, and cold chain compliance terms are written in real time in the time-propagation constraints and objective functions, thus closing the “sense-predict-optimize” loop. This closes the “sense-predict-optimize” loop. The predictor is located at the edge node and updates parameters in real time using a rolling window. It provides the downstream path solver with continuous hot-start and constraint calibration, enabling replanning within minutes in the event of tight order insertion or road perturbation. The time propagation is driven by the traveling time predicted by the CNN-BiGRU as shown in equation (3).
 (3)
(3)
In equation (3),  is the arrival moment.
  is the service hour.
  is obtained by CNN-BiGRU M online prediction, and M is a significantly large constant, typically assigned a value much greater than the total time span of the distribution horizon (e.g.,
  ), to ensure the time-propagation constraint remains logically valid when
  .
.
 |
Fig. 1 Schematic diagram of VRP emergency distribution (Icons in the picture are sourced from: https://yesicon.app/). |
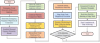 |
Fig. 2 Dynamic routing optimization process for emergency medical supplies based on AHP and edge computing. |
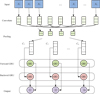 |
Fig. 3 CNN-BiGRU based time-varying feature extraction and parameter prediction module. |
2.2 Dynamic routing optimization algorithm driven by edge computing
While the CNN-BiGRU predictor supplies real-time travel time estimates and demand intensity forecasts, these parameters alone do not constitute actionable routing decisions. The predicted values must be integrated into a decision-making framework that can balance multiple competing objectives, such as minimizing transportation costs, respecting time windows, and prioritizing high-urgency demands, under dynamic constraints. This necessitates an optimization algorithm that can rapidly adapt to evolving conditions at the edge layer.
To update paths online at the edge nodes at the minute level and seamlessly integrate with the VRP objective and soft time window constraints, the system first aggregates multi-source streaming data continuously. This data includes roadway speed, congestion events, vehicle loads, box temperatures, and departmental immediate demands. The system aggregates this data at the vehicle and hospital sites. Subsequently, the edge-side timing prediction module generates key variable parameters: roadway travel time prediction  and demand intensity
  . These two types of quantities are directly written into the time propagation constraints and tardiness penalties, creating a stronger “tardiness penalty” for demand points with higher urgency weights
  . To achieve a stable balance between computation and delay, the prediction layer adopts a parallel computing architecture of ‘Transformer plus GRU'. The edge predictor based on Transformer is shown in Figure 4.
In Figure 4, the input/output embeddings are repeatedly stacked with the feedforward layer via the multi-head attention to form an alignable spatio-temporal context. Its role is to model the correlation between across-step and across-segment correlation for multi-source sequences. The outputs are linearly mapped into  and
and  .
.  enters the temporal propagation constraint.
  is used to trigger replanning with dynamic scaling of
  . The scaled dot product attention used in Transformer is shown in equation (4).
 (4)
(4)
In equation (4),  are the query, key, and value matrix, respectively.
  is the key vector dimension. The attention weights complete the weighted aggregation of historical moments with neighboring road segments so as to dynamically correct the
  to reflect congestion and event shocks. The GRU unit with rolling update structure is shown in Figure 5.
Figure 5 emphasizes that in edge nodes with limited arithmetic and bandwidth, the lighter GRU can complete rolling inferences in seconds as a redundant or alternative link to the Transformer. The standard gating and state update of the GRU is shown in equation (5).
 (5)
(5)
In equation (5),  is the current step feature.
  is the hidden state.
  and
and  are update gate and reset gate respectively.
  is the Sigmoid. Edge nodes infer accordingly on a second rolling basis and directly output
  . It is instantly backfilled into the time propagation constraint
  to make the replanning sensitive to the latest passing conditions. The parallel computing architecture exhibits distinct computational characteristics under edge hardware constraints. Benchmarking on 8-core CPUs reveals that Transformer inference requires 42–58 ms per prediction step with peak memory usage of 1.2 GB, achieving MAE of 2.3 min for travel time estimation. In contrast, GRU completes inference in 8–15 ms with 380 MB memory footprint, albeit with slightly degraded MAE of 3.1 min. To balance accuracy and latency, the system uses an adaptive fusion mechanism. During periods of low load (road network occupancy <60% and pending orders <15), the system uses Transformer predictions to maximize accuracy. When edge node CPU utilization exceeds 75% or memory availability drops below 2 GB, the controller automatically switches to GRU-only mode to maintain a decision latency of less than 100 ms. Under moderate load (60–75% occupancy), both models run in parallel, and their outputs are fused via inverse-variance weighting:
  where weights are inversely proportional to historical error variances. This adaptive strategy ensures robust performance across varying network dynamics without manual intervention. In order to truncate the target control update magnitude so as to consistently produce high-quality candidates and support minute-level rolling replanning, the study introduces the PPO strategy-value-advantage approach as shown in Figure 6.
Figure 6 connects the strategy network, value network, and reference/reward modeling with generalized advantage estimation (GAE) for short-round, low-step stabilization updates on the edge side [18]. The core of PPO is to truncate the old/new strategy ratio to avoid oversized updates. The truncation objective used is shown in equation (6).
 (6)
(6)
In equation (6),  is the truncated agent target.
  is the advantage.
  is the truncation radius.
  is the expectation of the time step t.
  is the strategy ratio as shown in equation (7).
 (7)
(7)
In equation (7),  is the current (to-be-updated) policy with parameter θ.
  is the old policy used when collecting this trajectory.
  is the state of the moment t. at is the actual action taken under st. The numerator denominator is the probability (discrete action) or probability density (continuous action) of the action under the old and new strategies, respectively. Equation (8) is used as the total loss to stabilize learning during training.
 (8)
(8)
In equation (8), Rt is the rolling return.  is the value function.
  controls the weight of the value loss.
  is the entropy of the strategy distribution. The clipping parameter is set to ε = 0.2, a widely adopted value in reinforcement learning tasks that effectively balances the trade-off between policy update stability and convergence speed by constraining the probability ratio within a reliable range [0.8, 1.2].
The study ensures that the action of “reducing urgency-weighted tardiness and transportation costs” is more rewarding. The ALNS and PPO fusion mechanism facilitates a two-stage optimization process. First, the PPO agent acts as a high-level decider, generating initial routing candidates and adaptive operator selections based on real-time edge data. These candidates are then subjected to heuristic refinement via ALNS and feasibility checks (capacity, time window, cold chain, and driver hours). This coordination combines the rapid inference of reinforcement learning for global exploration with the robust local search capability of meta-heuristics for fine-tuning solutions [19]. To adapt to the explosive nature of emergency services, PPO update adopts the setting of “short rounds, multiple small batches, and low learning rate”, and reuses the trajectories in the edge cache to realize hot start. When a new order or a road state change triggers an event, only local rescheduling is done within the affected subgraph, so that the optimization computation is controlled in milliseconds to seconds [20].
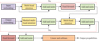 |
Fig. 4 Transformer-based edge predictor. |
 |
Fig. 5 GRU unit with rolling update structure. |
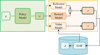 |
Fig. 6 PPO strategy-value-advantage flow. |
3 Results
3.1 Model prediction accuracy and scale generalization performance evaluation
Experiments are conducted on city-level road network data covering an urban area of approximately 450 km2. The network consists of 1,280 kilometers of roads with an average density of 2.84 km/km2. Road segments and intersections are extracted from OpenStreetMap and aligned with historical driving trajectories. The order flow is constructed based on the historical arrival rate of hospital emergency supplies and superimposed with Poisson impulses and event perturbations (road closure, sudden congestion), with a rolling window of 1 min and a maximum of 12 steps. The Poisson impulse intensity is set to λ = 0.5 for road closures and λ = 1.2 for sudden order surges per hour. This configuration simulates the high-frequency, low-probability characteristics of emergency events, ensuring the temporal distribution of disturbances aligns with real-world public health crisis patterns.
The evaluation set and the training/validation set are time-sliced (60%/20%/20%) and the experiments are replicated with 5 random seeds. Predictions and decisions are executed in real-time at edge nodes with 4–8 core CPUs and 8–16 GB memory on the edge side, targeting end-to-end latency≤100 ms. Offline training and hyperparametric search are done server-side, exemplified by 1 × GPU (≥24 GB graphics memory) with 32 GB RAM. EC-EMRO's predictor uses Transformer (2 layers, 4 heads) + GRU (hidden dimension 128) to generate  and
and  . The online solver utilizes ALNS + PPO, where the clipping parameter is set to ε = 0.2. This value is selected based on empirical standards in reinforcement learning to effectively constrain the policy update magnitude, thereby preventing performance collapse while ensuring stable convergence (γ = 0.99, λ = 0.95, K = 4 small batch updates).
The study selects learning to iteratively solve routing problems with dual-aspect collaborative transformer (DACT), policy optimization with multiple optima for reinforcement learning (POMO), learning generalizable models for VPRs via adaptive multi-distribution knowledge distillation (AMDKD) and the EC-EMRO proposed by the study for comparison. Comparison of errors at different rolling steps is shown in Figure 7.
The horizontal axis represents the number of rolling steps (1–12), while the vertical axis denotes the error metrics (MAE, RMSE, and MAPE). In all subfigures, the solid blue line representing EC-EMRO consistently remains below the baseline models (AMDKD, POMO, DACT). As the forecasting horizon extends, the error growth rate of EC-EMRO is significantly lower, demonstrating superior long-term stability in dynamic environments. This superior long-term stability can be attributed to the complementary mechanisms of the Transformer-GRU architecture. The Transformer's multi-head attention mechanism allows for the explicit modeling of long-range spatiotemporal correlations. This is achieved by assigning attention weights to historical time steps and geographically distant road segments. For example, when predicting travel time at step t + 12, the attention layers selectively retrieve relevant patterns from steps t-30 to t. This captures recurring congestion cycles and spatial dependencies, such as the propagation of upstream bottlenecks. This prevents error accumulation that plagues recurrent-only models, which tend to degrade exponentially beyond 6–8 steps. Concurrently, the GRU's gating structure acts as a noise filter: the reset gate discards irrelevant fluctuations such as transient GPS jitter, while the update gate preserves stable trend components. In high-variance scenarios including sudden weather changes or sporadic road closures, GRU gates adaptively down-weight noisy observations, preventing outlier propagation into future predictions. The combination of Transformer's global context awareness and GRU's selective memory retention is what explains the minimal error growth observed across extended rolling horizons. As illustrated in Figure 7, EC-EMRO consistently exhibits the lowest error metrics (MAE, RMSE, MAPE) across all rolling steps (1–12), with notably slower growth rates compared to baseline models. The solid blue curves remain significantly below AMDKD, POMO, and DACT, demonstrating superior long-term stability.
The subfigures illustrate trends in precision and accuracy relative to the test sample size, which ranges from 100 to 1,000. The vertical axis shows the performance percentage. The EC-EMRO curve shows a stable plateau near 98%, while the DACT and POMO curves demonstrate high volatility and a downward trend with smaller sample sizes. This trend confirms the superior scale generalization of the proposed framework. Figure 8 further validates the scale generalization capability. EC-EMRO maintains stable performance at around 98% across different test sample sizes (100–1,000), whereas DACT and POMO demonstrate high volatility and degradation with smaller sample sizes, with respective precision levels dropping to 70%–82%. A comparison of the on-time compliance judgments and prioritization metrics is shown in Table 1.
In Table 1, EC-EMRO leads overall in the two types of tasks of “on-time compliance” discrimination and priority ranking: its F1 score is 0.914, precision score is 0.928, and recall score is 0.900. This is 0.091, 0.083, and 0.098 higher than DACT, 0.047, 0.049, and 0.045 higher than POMO, and 0.025, 0.027, and 0.022 higher than AMDKD, respectively. ROC-AUC reaches 0.967, further expanding the classification separability advantage compared to DACT, POMO, and AMDKD's 0.915/0.942/0.953. In terms of probability calibration, the ECE is 1.87% (compared to 4.63%/3.21%/2.74% in the control model), indicating that its compliance probability is closer to the true frequency. In terms of urgency driven sorting performance, NDCG@5 is 0.934, higher than DACT's 0.861, POMO's 0.892, and AMDKD's 0.907. The coverage of high urgency demand points in the forefront is more comprehensive, providing a more reliable priority list for subsequent rolling re planning.
 |
Fig. 7 Comparison of errors with different number of rolling steps. |
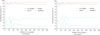 |
Fig. 8 Trajectories of the performance of the four methods with respect to size for different test sample sizes. |
Comparison of on-time compliance criteria and prioritization indicators.
3.2 Edge computing-driven prediction decision collaboration performance verification and robustness evaluation
The study uses experimental data as a rolling window sample of the urban road network N = 2500N, with features containing roadway speeds, event markers, and meteorology. The labels are observed driving times (50–100 min). The chronological cut is 0–2,000 for training/validation (8:2) and 2,001–2,500 for testing. The horizontal axis “Sample Index” corresponds to the sample number. The dashed line in the figure shows the cut-off position, and the scatter points are compared to the y = x reference line. The EC-EMRO predictor is configured as Transformer (2 layers, 4 heads) + GRU (hidden layer 128) with Adam learning rate 1 × 10⁻⁴ and rolling step 1 min. The metrics use MAE, RMSE, and MAPE with R2, and the two methods share the same preprocessing and constraints. Hardware: Edge inference runs in real-time on an 8-core CPU/16 GB RAM. Offline training is done on a 1 × GPU (≥24 GB graphics memory) with 32 GB RAM on a server. The travel time prediction calibrated scatterplot example is shown in Figure 9.
The scatterplots compare predicted versus observed travel times (50–100 min). The diagonal line y = x represents the ideal prediction. In subfigure (a), the EC-EMRO data points form a tight cluster along the reference line, indicating minimal systematic bias. Conversely, subfigure (b) shows significant dispersion for AMDKD, with a notable underestimation in the high-duration segments. This highlights the effectiveness of the Transformer-GRU hybrid structure. The sensitivity analysis of key parameters is shown in Table 2.
Table 2 reveals that edge node computational power directly impacts replanning efficiency. Reducing computing power by 50% nearly doubles the time required for replanning (from 45.20 ms to 88.63 ms). Meanwhile, network degradation (100 ms of additional latency or 3% packet loss) significantly increases total decision latency beyond 180 ms. This subsequently raises transportation costs by up to 10% and extends average delays to 16.26 min. In city-level deployments with distributed edge nodes, the framework addresses single-point overload through task migration and collaborative computing. When a node experiences sustained CPU utilization above 85% or excessive task queue depth, optimization requests for adjacent service zones are offloaded to neighboring nodes within geographical proximity. In large-scale replanning scenarios, VRP instances are decomposed spatially into subproblems that are assigned to different edge nodes. These subproblems are then solved and the solutions are merged via a lightweight coordination layer. This multi-node collaboration reduces peak node load by 40–60% during surge events while maintaining sub-100 ms decision latency. The robustness analysis of the algorithm under dynamic event perturbation is shown in Table 3.
In Table 3, in the baseline scenario, the average total transportation cost of the model is 31,572.4813 yuan and the weighted average tardiness is 4.1377 min. As the intensity of the perturbation increases, the cost metrics rise. For example, under the medium perturbation (30% congestion, 10% new orders), the average total transportation cost rises to 37,451.9288 yuan, with a cost growth rate of 18.6221%. Even under extreme perturbations that include 50% road congestion and 20% new orders, the system still accomplishes 95.5% of the delivery tasks. Crucially, the standard deviation of the replanning computation time is consistently low, increasing slightly from 1.8834 ms in the baseline to 4.0278 ms under the extreme perturbation. This indicates that the decision elapsed time of the algorithm maintains a high degree of consistency and stability under different loads, proving that the EC-EMRO model can robustly cope with the high level of uncertainty in real emergency scenarios.
The algorithmic robustness under extreme perturbations stems from two key mechanisms. First, PPO's clipped surrogate objective prevents policy oscillations during sudden disturbances. When 20% new orders arrive within a single hour, the policy network must rapidly adapt to expand route coverage. However, unconstrained policy updates risk overreacting, causing the agent to abandon viable partial routes in favor of drastically different configurations that may violate time windows. The clipping parameter, ε = 0.2, constrains the probability ratio to [0.8, 1.2]. This ensures that policy updates remain conservative, and the agent adjusts vehicle assignments incrementally rather than executing a disruptive full rescheduling. This truncation mechanism maintains solution feasibility across 95.5% of tasks even when half the road network is congested. Second, ALNS's destroy-repair operators enable efficient localized replanning. When a road closure affects three out of 15 total vehicles, the destroy operator removes only the impacted routes targeting congested segments. Meanwhile, the repair operator reconstructs feasible alternatives within the affected neighborhood through greedy insertion. This selective perturbation confines computation to 8–12 ms bursts rather than re-optimizing the entire fleet, explaining the consistently low standard deviation (≤4.03 ms) of replanning time. The combination of PPO's stability guarantee and ALNS's surgical adaptability ensures graceful degradation under escalating disturbance intensities.
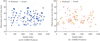 |
Fig. 9 Scatter comparison of travel time prediction calibration. |
Sensitivity analysis of key parameters.
Robustness analysis of the algorithm under dynamic event perturbation.
4 Summary and future work
In the face of major public health emergencies, the traditional distribution system for emergency supplies generally suffers from the bottleneck of high response delay and inability to adapt to the dynamic environment due to its centralized decision-making structure, which seriously restricts the rescue efficiency. To address this problem, the study proposed and validated an EC-EMRO optimization framework. The framework quantified the demand urgency through AHP, combined Transformer with GRU timing predictor to infer key parameters online, and utilized PPO reinforcement learning algorithm to perform millisecond rolling path replanning on the edge side. The essence of this study extends beyond sinking computing power to the edge. It constructs an edge-intelligent decision engine characterized by a “perception-prediction-optimization-execution-correction” closed-loop. The framework achieves a paradigm shift in emergency logistics decision-making by embedding urgency quantification and uncertainty prediction directly into the solver, shifting the focus from static presetting to dynamic adaptation. In performance comparisons, the prediction accuracy of the EC-EMRO model was consistently and stably maintained above 96% at different sample sizes. In the on-time attainment discrimination task, the model achieved a precision and recall of 0.928 and 0.900, respectively, showing strong classification performance. The robustness of the model was verified in the dynamic perturbation test. Under the pressure of moderate perturbation (30% road congestion, 10% new orders/hour), the system still managed to control the average total transportation cost at 37,451.9288 yuan. In addition, a sensitivity analysis quantified the impact of the hardware base on the model performance. The results indicated that when edge node arithmetic decreased to 50% of the benchmark, the average total decision latency increased significantly, from 87.4316 ms to 130.8607 ms. This directly led to an increase in transportation costs, highlighting the necessity of high-performance edge infrastructure. Despite the positive results of the research, certain limitations still exist. Although the current simulation environment strives for high fidelity, it is still unable to fully reproduce all the incidental factors in the real world, such as driver behavior and unstructured road obstacles. Additionally, the assumptions underlying data generation have inherent limitations. Real-world demand surges during emergencies may differ from the Poisson distribution used in simulations. Furthermore, road congestion often exhibits spatial correlations that independent perturbation models do not fully capture. In the future, the research can take new carriers such as UAVs into consideration and study the multi-modal intermodal routing optimization problem under air-ground coordination.
Symbol description
uj Weight of indicator j obtained by AHP and consistency test
zij Normalized value of demand point i for indicator j
wi Calculated demand urgency for point i
α,β Policy weights for transportation cost and tardiness penalty
cij(τ) Unit transportation cost at rolling moment τ
xijk Binary decision variable for vehicle k traveling from i to j
ϕi Unit cost of tardiness for demand point i
ti,li Arrival moment and soft time window at node i
t^ij(τ) Predicted travel time from CNN-BiGRU
M A significantly large constant for time propagation relaxation
rt(θ) Strategy ratio between new and old policies in PPO
At Advantage estimation at time step t
ϵ Truncation radius to stabilize PPO policy updates
Fundings
The research is supported by Special project of Shaanxi Provincial Department of Education in 2019: Research on urban distribution mode based on new energy logistics vehicles (Project No: 19JK0086).
Conflicts of interest
All authors declare that they have no conflicts of interest.
Data availability statement
The datasets generated during and/or analysed during the current study are available from the corresponding author on reasonable request.
Author contribution statement
The sole author of this manuscript is responsible for the entire research process.
References
- J.B. Nuzzo, L.L. Borio, L.O. Gostin, The WHO declaration of monkeypox as a global public health emergency, JAMA, 328, 615–617 (2022) [Google Scholar]
- N. Altay, G. Heaslip, G. Kovács, K. Spens, P. Tatham, A. Vaillancourt, Innovation in humanitarian logistics and supply chain management: a systematic review, Ann. Oper. Res. 335, 965–987 (2024) [Google Scholar]
- C. Reale, M.E. Salwei, L.G. Militello, M.B. Weinger, A. Burden, C. Sushereba, S. Anders, Decision-making during high-risk events: a systematic literature review, J. Cogn. Eng. Decis. Mak. 17, 188–212 (2023) [Google Scholar]
- D.C. Nguyen, Q.V. Pham, P.N. Pathirana, M. Ding, A. Seneviratne, Z. Lin, W.J. Hwang, Federated learning for smart healthcare: a survey, ACM Comput. Surv. 55, 1–37 (2022) [Google Scholar]
- R. Dwivedi, D. Mehrotra, S. Chandra, Potential of internet of medical things (IoMT) applications in building a smart healthcare system: a systematic review, J. Oral Biol. Craniofac. Res. 12, 302–318 (2022) [Google Scholar]
- H. Kwon, S. An, H.Y. Lee, W.C. Cha, S. Kim, M. Cho, H.J. Kong, Review of smart hospital services in real healthcare environments, Healthc. Inform. Res. 28, 3–15 (2022) [Google Scholar]
- B.G. Mohammed, D.S. Hasan, Smart healthcare monitoring system using IoT, Int. J. Interact. Mob. Technol. 17, 141–152 (2023) [Google Scholar]
- S. Bojjagani, Y.P. Reddy, T. Anuradha, P.V. Rao, B.R. Reddy, M.K. Khan, Secure authentication and key management protocol for deployment of Internet of Vehicles (IoV) concerning intelligent transport systems, IEEE Trans. Intell. Transp. Syst. 23, 24698–24713 (2022) [Google Scholar]
- F.M. Talaat, Effective prediction and resource allocation method (EPRAM) in fog computing environment for smart healthcare system, Multim. Tools Appl. 81, 8235–8258 (2022) [Google Scholar]
- J. Shen, K. Liu, C. Ma, Y. Zhao, C. Shi, Bibliometric analysis and system review of vehicle routing optimization for emergency material distribution, J. Traffic Transp. Eng. (English Edition), 9, 893–911 (2022) [Google Scholar]
- K. Khalili-Damghani, M. Tavana, P. Ghasemi, A stochastic bi-objective simulation–optimization model for cascade disaster location-allocation-distribution problems, Annals Oper. Res. 309, 103–141 (2022) [Google Scholar]
- F. Chen, J. Chen, J. Liu, Forecast of flood disaster emergency material demand based on IACO-BP algorithm, Neural Comput. Appl. 34, 3537–3549 (2022) [Google Scholar]
- J. Liu, Y. Li, Y. Li, C. Zibo, X. Lian, Y. Zhang, Location optimization of emergency medical facilities for public health emergencies in megacities based on genetic algorithm, Eng. Constr. Archit. Manag. 30, 3330–3356 (2023) [Google Scholar]
- S. Ergün, P. Usta, S.Z. Alparslan Gök, G.W. Weber, A game theoretical approach to emergency logistics planning in natural disasters, Ann. Oper. Res. 324, 855–868 (2023) [Google Scholar]
- M. Cengiz Toklu, A fuzzy multi-criteria approach based on Clarke and Wright savings algorithm for vehicle routing problem in humanitarian aid distribution, J. Intell. Manuf. 34, 2241–2261 (2023) [Google Scholar]
- G. Maksimović, Application of analytical hierarchy process for emergency managers selection, J. Decis. Anal. Intell. Comput. 4, 253–262 (2024) [Google Scholar]
- Y. Mo, Z. Sun, C. Yu, Eventtube: an artificial intelligent edge computing based event aware system to collaborate with individual devices in logistics systems, IEEE Trans. Ind. Inform. 19, 1823–1832 (2023) [Google Scholar]
- M.B. de Melo, D. Daldegan-Bueno, M.G. Menezes Oliveira, A.L. de Souza, Beyond ANOVA and MANOVA for repeated measures: advantages of generalized estimated equations and generalized linear mixed models and its use in neuroscience research, Eur. J. Neurosci. 56, 6089–6098 (2022) [Google Scholar]
- A. Bogyrbayeva, M. Meraliyev, T. Mustakhov, B. Dauletbayev, Machine learning to solve vehicle routing problems: a survey, IEEE Trans. Intell. Transp. Syst. 25, 4754–4772 (2024) [Google Scholar]
- R.S. Dornelas, D.A. Lima, Correlation filters in machine learning algorithms to select de-mographic and individual features for autism spectrum disorder diagnosis, J. Data Sci. Intell. Syst. 3, 7–9 (2023) [Google Scholar]
Cite this article as: Lina Guo, Edge computing-driven distribution routing optimization of emergency medical supplies in smart logistics and smart healthcare systems, Int. J. Metrol. Qual. Eng. 17, 7 (2026), https://doi.org/10.1051/ijmqe/2026003
All Tables
All Figures
|
Fig. 1 Schematic diagram of VRP emergency distribution (Icons in the picture are sourced from: https://yesicon.app/). |
| In the text | |
|
Fig. 2 Dynamic routing optimization process for emergency medical supplies based on AHP and edge computing. |
| In the text | |
|
Fig. 3 CNN-BiGRU based time-varying feature extraction and parameter prediction module. |
| In the text | |
|
Fig. 4 Transformer-based edge predictor. |
| In the text | |
|
Fig. 5 GRU unit with rolling update structure. |
| In the text | |
|
Fig. 6 PPO strategy-value-advantage flow. |
| In the text | |
|
Fig. 7 Comparison of errors with different number of rolling steps. |
| In the text | |
|
Fig. 8 Trajectories of the performance of the four methods with respect to size for different test sample sizes. |
| In the text | |
|
Fig. 9 Scatter comparison of travel time prediction calibration. |
| In the text | |
Current usage metrics show cumulative count of Article Views (full-text article views including HTML views, PDF and ePub downloads, according to the available data) and Abstracts Views on Vision4Press platform.
Data correspond to usage on the plateform after 2015. The current usage metrics is available 48-96 hours after online publication and is updated daily on week days.
Initial download of the metrics may take a while.