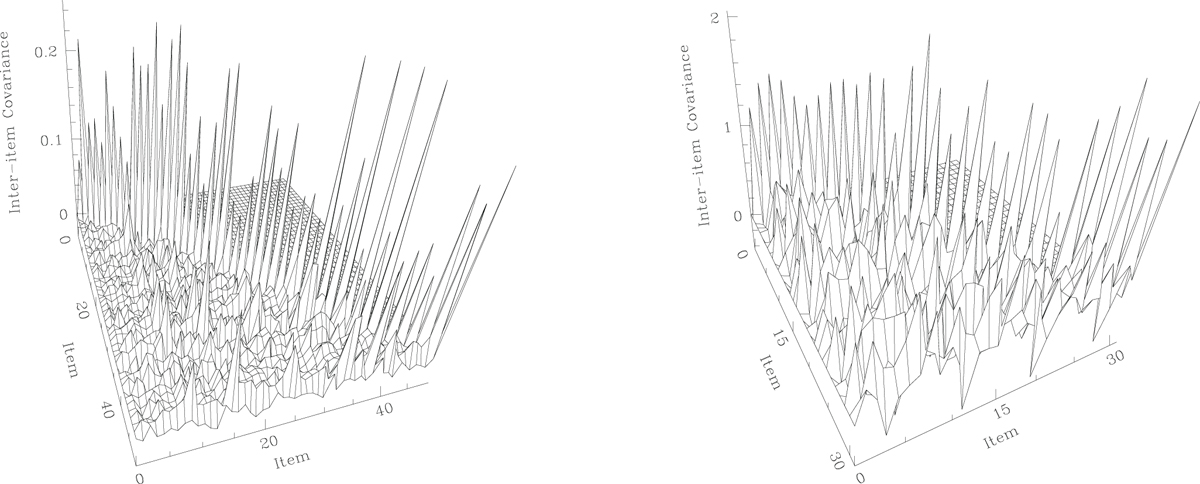
Fig. 9
Download original image
Surface plot of covariance between pairs of items in the given test data (DATA-I on the left, and HSQ in the right panel), plotted against item indices. Here only the lower-triangle of the inter-item variance-covariance matrix is plotted, i.e. covariance between the j-th and j′-th item is plotted ∀j/ ≤ j ; j = 1, 2, … , p; p = 50 for DATA-1 and p = 32 for HSQ. Non-uniformity in the covariance values are displayed in the plots. Outlying inter-item covariance values are parametrised by C, (discussed in Sect. 6.1). For HSQ, C ≈ 20%, while the inter-item covariance sample of DATA-I, causes C to about 8.7%.
Current usage metrics show cumulative count of Article Views (full-text article views including HTML views, PDF and ePub downloads, according to the available data) and Abstracts Views on Vision4Press platform.
Data correspond to usage on the plateform after 2015. The current usage metrics is available 48-96 hours after online publication and is updated daily on week days.
Initial download of the metrics may take a while.