Open Access
Fig. 8
Download original image
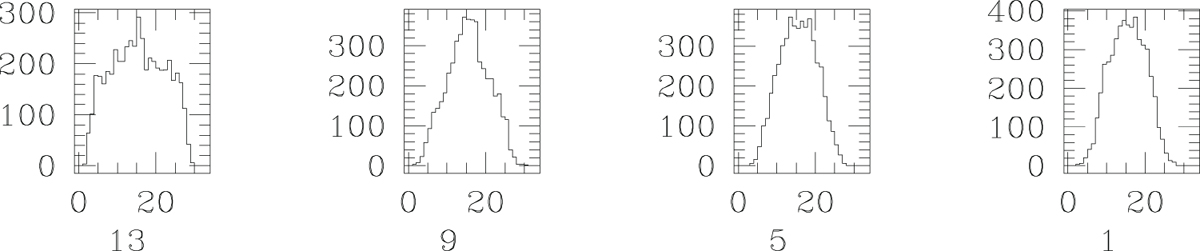
Marginal posterior probability density of the 1st, 5th, 9th and 13th item indices of an identified subtest between the subtest pair that real test data HSQ is split into. The marginals are represented as histograms here.
Current usage metrics show cumulative count of Article Views (full-text article views including HTML views, PDF and ePub downloads, according to the available data) and Abstracts Views on Vision4Press platform.
Data correspond to usage on the plateform after 2015. The current usage metrics is available 48-96 hours after online publication and is updated daily on week days.
Initial download of the metrics may take a while.