Fig. 7
Download original image
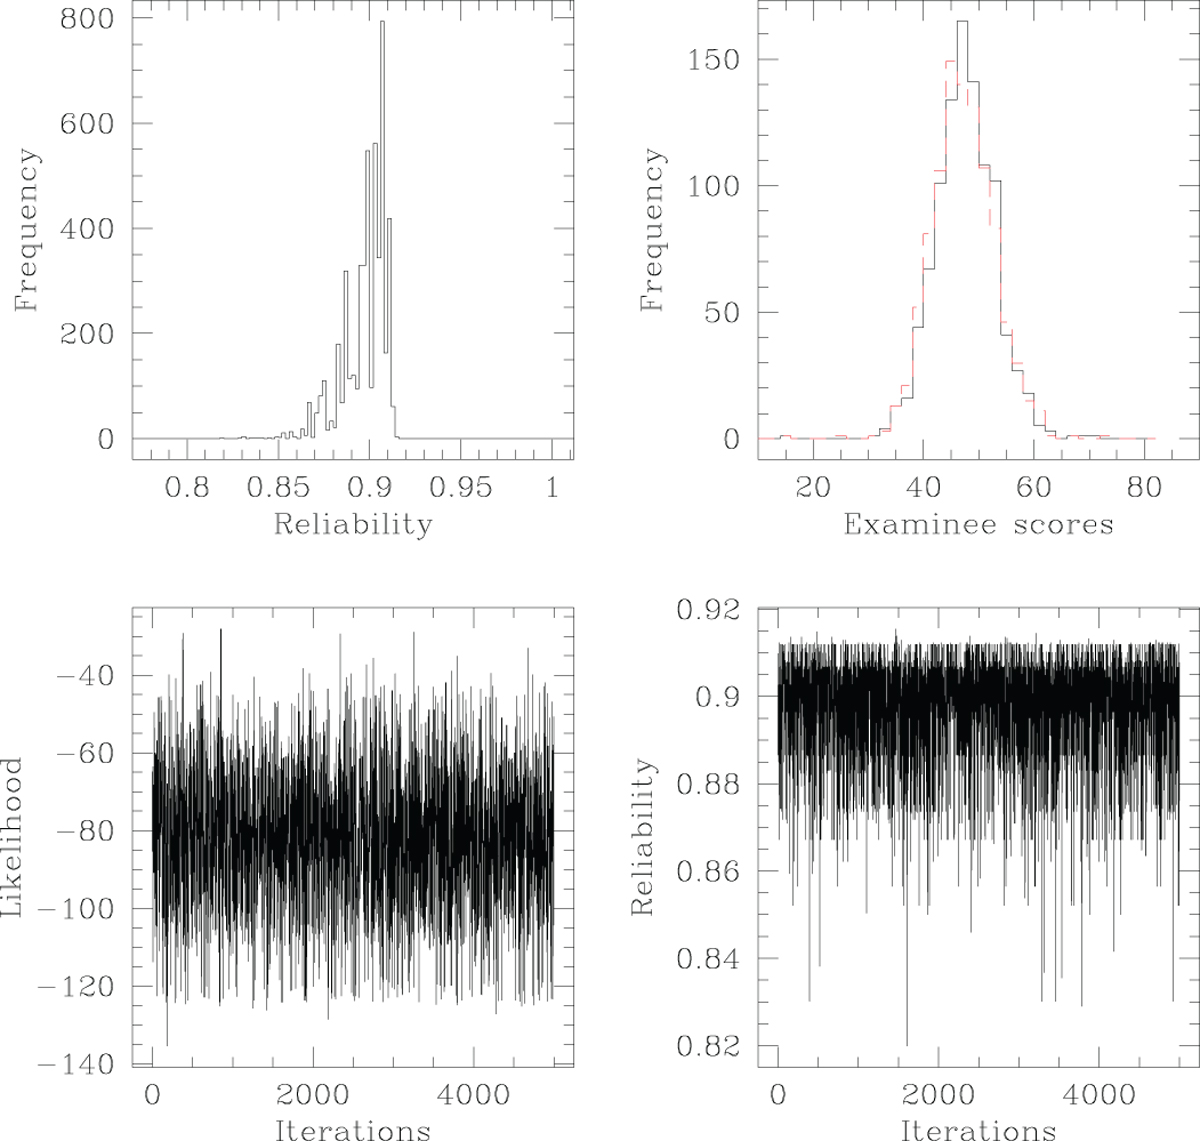
Figure representing results of Bayesian splitting the real survey dataset HSQ that comprises responses on a 5-point Likert scale. We use responses from n = 1022 responders (who we refer to generically as “examinees”) who answered every one of the 32 items of this test. Here we Bayesianly learn the indices of the items that comprise one of the subtests that the full test data is split into − we refer to this as the g-th subtest. The remaining items constitute the h-th subtest. Posterior sampling is performed with Independent Sampler Metropolis Hastings, in which each item index of the g-th subtest is proposed from a Binomial (32, ψ), with ψ ∼ Uniform [0.5 − a, 0.5 + a]; in this run, a = 0.2. At every iteration, reliability is computed using (Eq. (4)). Traces of this reliability, and of the likelihood are presented in the lower right, and lower left panels respectively. Histograms of examinee scores in the 2 subtests identified in the last iteration of our Bayesian inference, are shown in solid and broken lines on the top right.
Current usage metrics show cumulative count of Article Views (full-text article views including HTML views, PDF and ePub downloads, according to the available data) and Abstracts Views on Vision4Press platform.
Data correspond to usage on the plateform after 2015. The current usage metrics is available 48-96 hours after online publication and is updated daily on week days.
Initial download of the metrics may take a while.