Fig. 6
Download original image
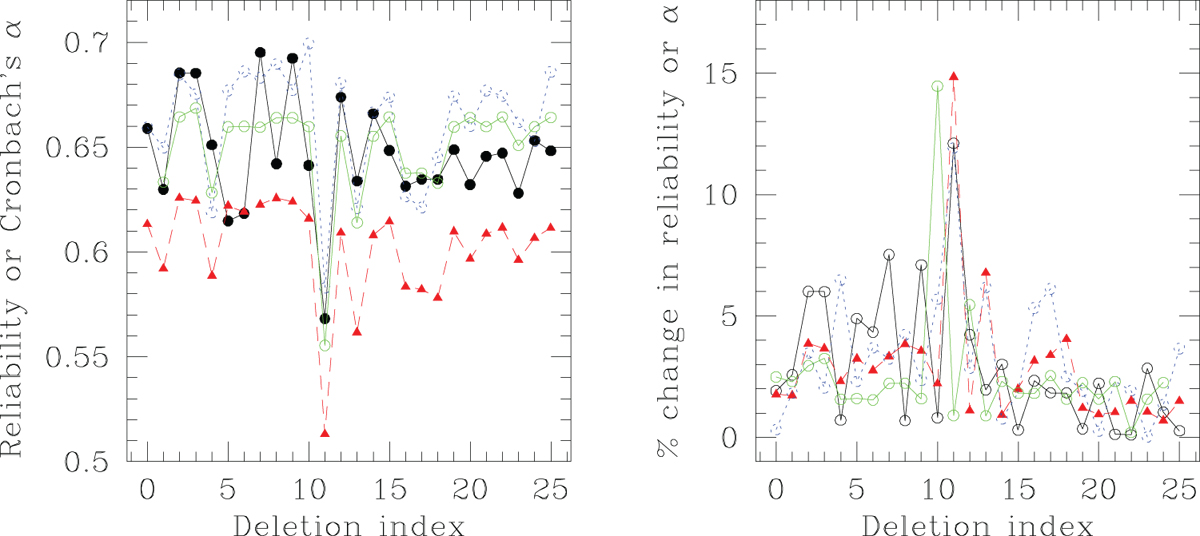
Left: figure to bring out robustness to outliers, of the different techniques for computing reliability. Reliability computed by deleting the q-th highest scoring pair of items − from the data on responses to the learnt subtests of the test/survey − is plotted against the deletion index q. Results otained with subtests learnt via minimisation of S are in black filled circles, joined by a black solid line); via maximisation of Sρ are in open circles joined by a broken line, (in blue in the electronic version); and via Bayesian inference on the indices of the items that comprise the g-th subtest are in filled circles joined by a grey solid line, (in green in the electronic version). Reliability computed by Cronbach alpha is also plotted in each case (in filled triangles joined by a broken line − in red in the electronic version). Right: the fractional change in reliability (over the reliability computed using a given method/definition for the whole test data DATA-I comprising 50 items), is plotted in the right panel, in corresponding line type and symbols (and colour). Variance of this fractional change (expressed as a percentage) is then computed for each of the 4 cases, and the Bayesianly identified reliability is the most robust, with a variance of about 2.452, while the reliability computed using splitting by maximising Sρ is the least robust (with a variance of about 3.252) The reliability computed by minimising S and Cronbach alpha are nearly equally robust, with variances of about 2.962 and 2.952 respectively.
Current usage metrics show cumulative count of Article Views (full-text article views including HTML views, PDF and ePub downloads, according to the available data) and Abstracts Views on Vision4Press platform.
Data correspond to usage on the plateform after 2015. The current usage metrics is available 48-96 hours after online publication and is updated daily on week days.
Initial download of the metrics may take a while.