Fig. 5
Download original image
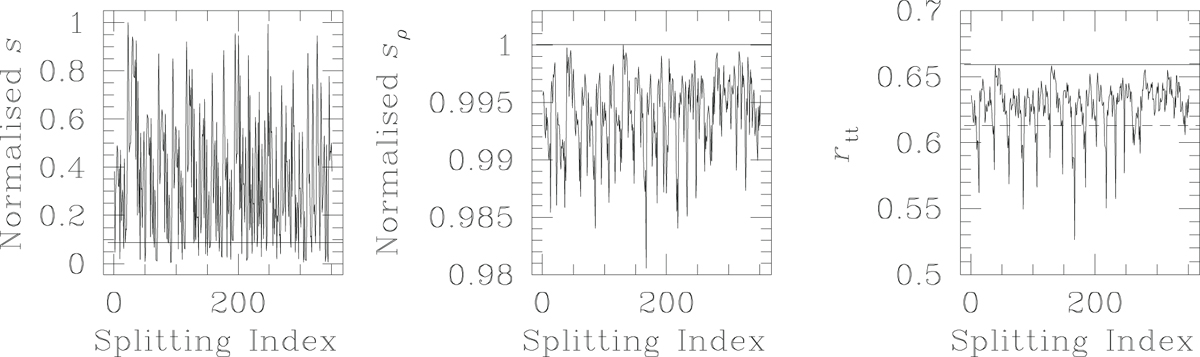
Figure showing results for each of the 351 possible splittings of the read test data DATA-I, where the said results include the absolute difference S between sums of components of the item score vectors in the 2 subtests that result from the splitting, (left panel); inner product Sρ of the subtest score vectors (middle panel); reliability rtt computed using the examinee score vectors implied by the current splitting of the test data, in equation (4) (right panel). These results are plotted against the splitting index, which takes values of 1,2,…351 for DATA-I. Our results by minimising S are overplotted in solid lines, on these results, in the right panel. Cronbach alpha for DATA-I is also computed and overplotted upon the computed reliability values in the right panel, in broken lines.
Current usage metrics show cumulative count of Article Views (full-text article views including HTML views, PDF and ePub downloads, according to the available data) and Abstracts Views on Vision4Press platform.
Data correspond to usage on the plateform after 2015. The current usage metrics is available 48-96 hours after online publication and is updated daily on week days.
Initial download of the metrics may take a while.