Fig. 3
Download original image
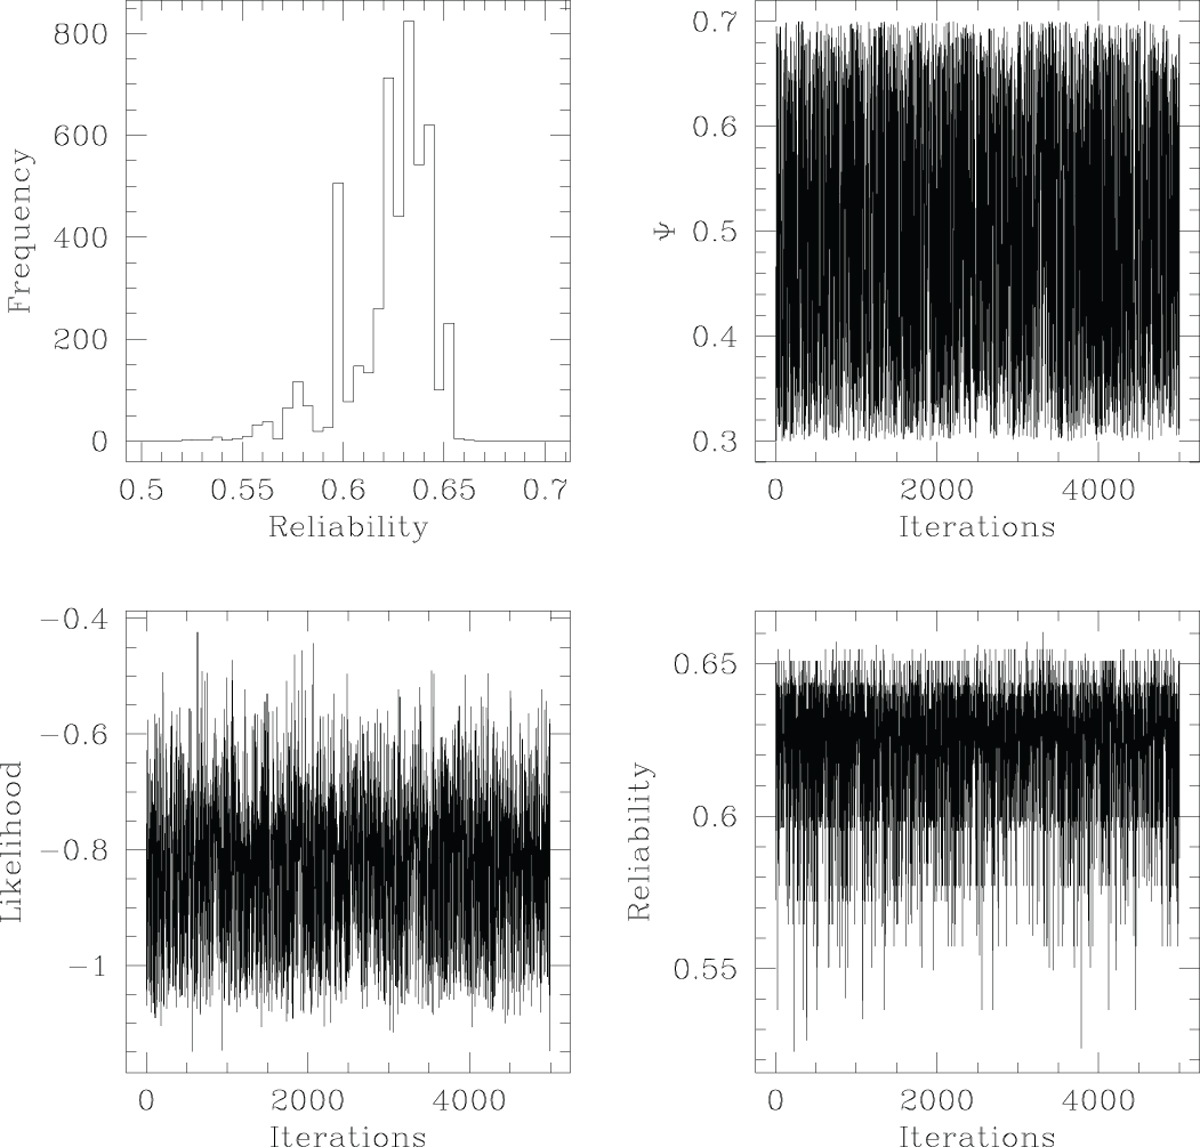
Figure representing results of splitting the real test dataset DATA-I that comprises responses of n = 912 examinees in 50 items, using Bayesian learning of the indices of the items in the g-th subtest. The remaining items constitute the h. −th subtest. Posterior sampling is performed with Independent Sampler Metropolis Hastings, in which each item index of the g-th subtest is proposed from a Binomial (50, ψ), with ψ ∼ Uniform [0.5 − a, 0.5 + a]; in this run, a = 0.2. At every iteration, reliability is computed using equation (4). Traces of this reliability, of ψ, and of the likelihood are presented in the lower right, top right and lower left panels respectively; the traces indicate convergence.
Current usage metrics show cumulative count of Article Views (full-text article views including HTML views, PDF and ePub downloads, according to the available data) and Abstracts Views on Vision4Press platform.
Data correspond to usage on the plateform after 2015. The current usage metrics is available 48-96 hours after online publication and is updated daily on week days.
Initial download of the metrics may take a while.