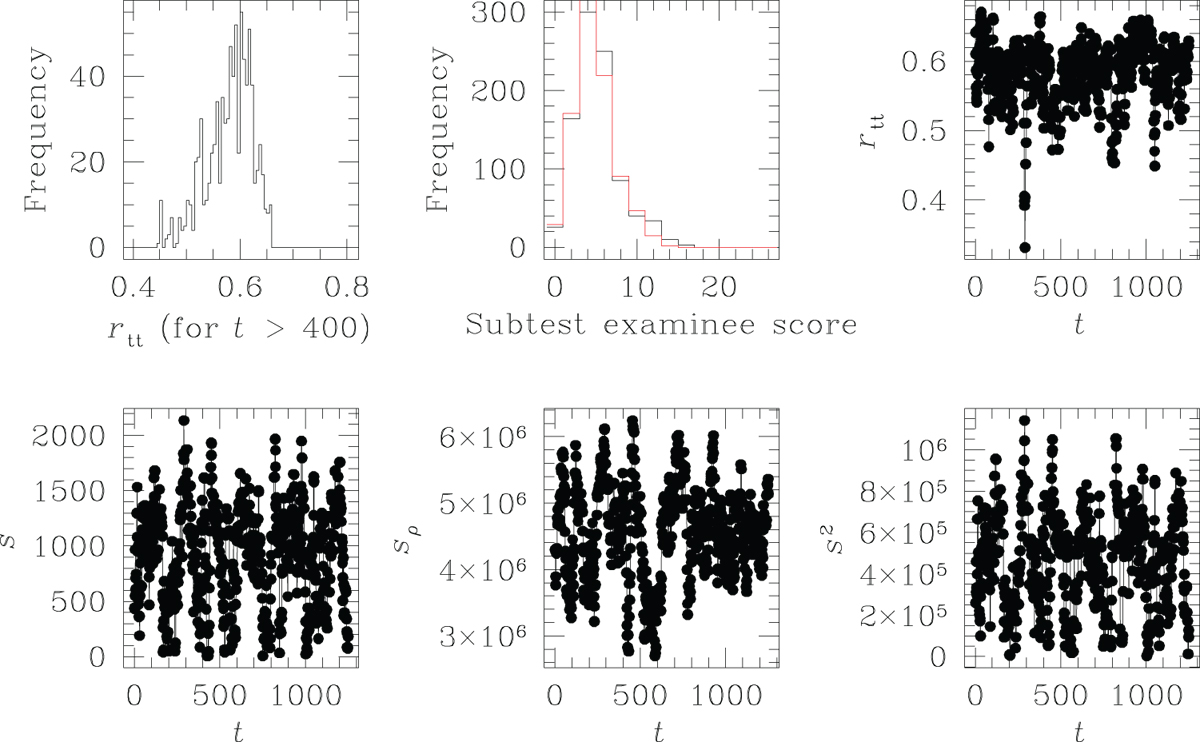
Fig. 2
Download original image
As in Figure 1, but in this run, splitting of real test data DATA-I is undertaken to maximise the value Sρ of the inner product Sρ of item score vectors in the g-th and h-th subtests. Here, the lower right panel displays a plot against the splitting index t, of the value S2 of the absolute difference between sum of squares of components of the item score vectors in the current g-th and the current h-th subtests. N.B. Due to the permitted swapping of the j-th item of the current g-th subtest by the j′-th item of the current h-th subtest, (j ≠ j′), under splitting by maximisation of Sρ, sum of components of the 2 subtest item score vectors, can be more different, than when swapping across rows of the 2 subtests is not permitted, as under splitting by minimising S.
Current usage metrics show cumulative count of Article Views (full-text article views including HTML views, PDF and ePub downloads, according to the available data) and Abstracts Views on Vision4Press platform.
Data correspond to usage on the plateform after 2015. The current usage metrics is available 48-96 hours after online publication and is updated daily on week days.
Initial download of the metrics may take a while.