Fig. 10
Download original image
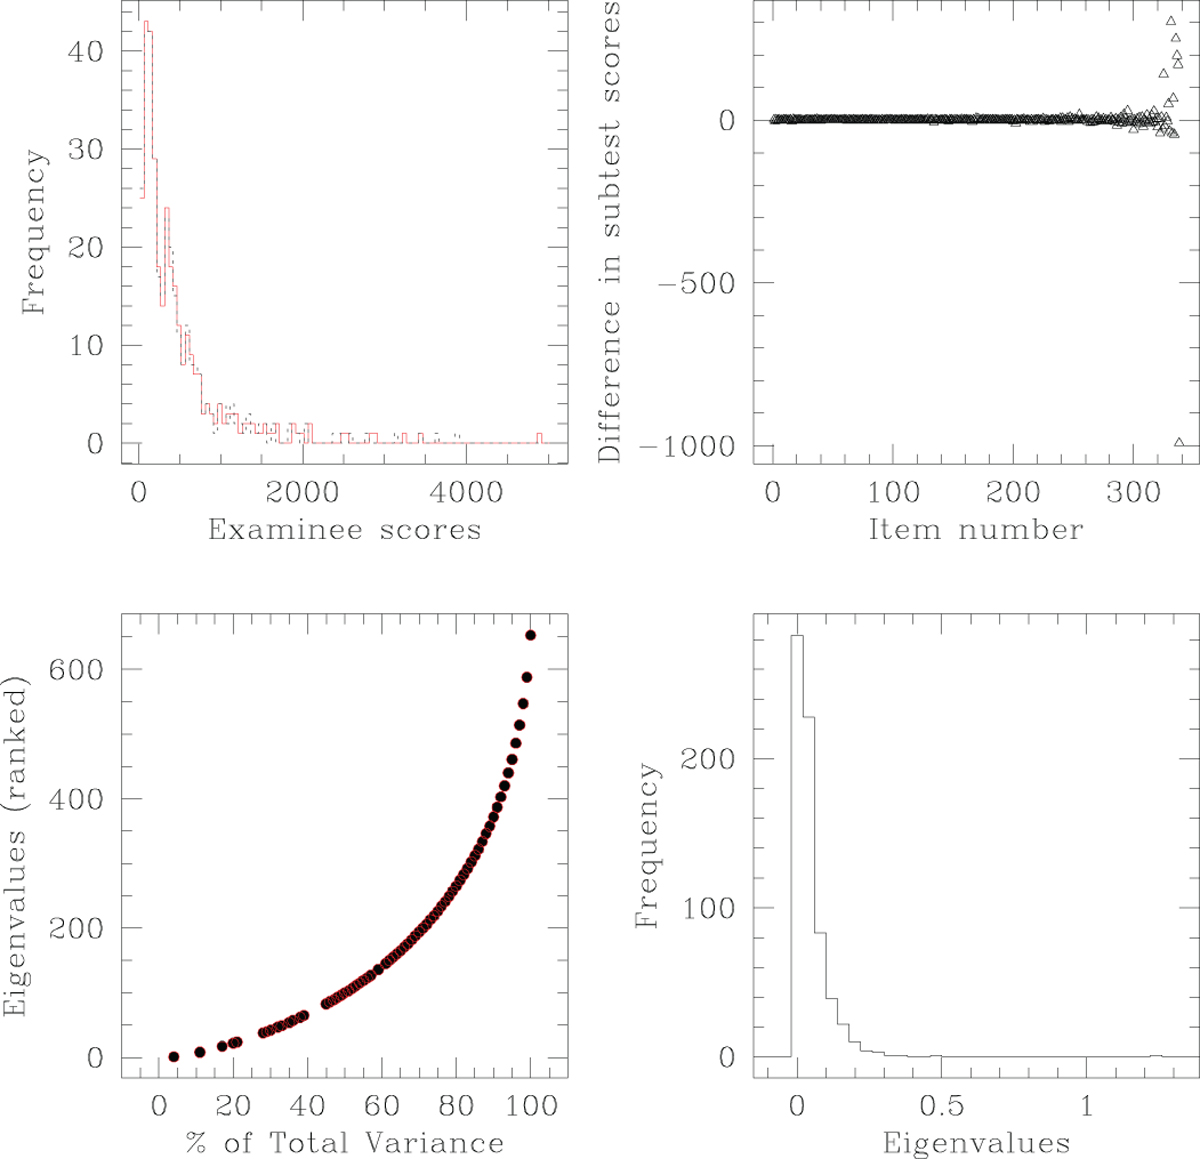
Figure representing results obtained using the very large real dataset DATA-YELP that comprises binary responses on 676 variables (or items), by 8848 responders (or examinees). The eigenvalue weight distribution is shown by the histogram in the lower right panel. Relevance of at least 6 of eigenvalues is indicated by this result. Indeed, when eigenvalues, ranked by their weights, are monitored, (lower left panel), it is found that to explain 20% of the total variation, about 3 eigenvalues need to be used. This plot of eigenvalues against explained fractional variation, is drawn by undertaking the PCA for 4424 rows of the data, and then for the full dataset; results from the latter analysis is plotted in black full circles and results for half the dataset is then overplotted in open grey (or red in the electronic version) circles. The upper panels display results of the splitting done by minimising S. In the upper left panel, histograms of the examinee score vectors in the 2 subtests that result from the splitting of DATA-YELP test data, are overplotted in black broken lines and grey (or red in the electronic version) solid lines. The upper right panel then displays the differences between the examinee scores in the j-th items of the g-th and h-th subtests, plotted against j; here j = 1,…,676/2 = 338. Reliability corresponding to the minimisation of S is about 0.93, while Cronbach alpha for this data is about 0.91.
Current usage metrics show cumulative count of Article Views (full-text article views including HTML views, PDF and ePub downloads, according to the available data) and Abstracts Views on Vision4Press platform.
Data correspond to usage on the plateform after 2015. The current usage metrics is available 48-96 hours after online publication and is updated daily on week days.
Initial download of the metrics may take a while.