Fig. 1
Download original image
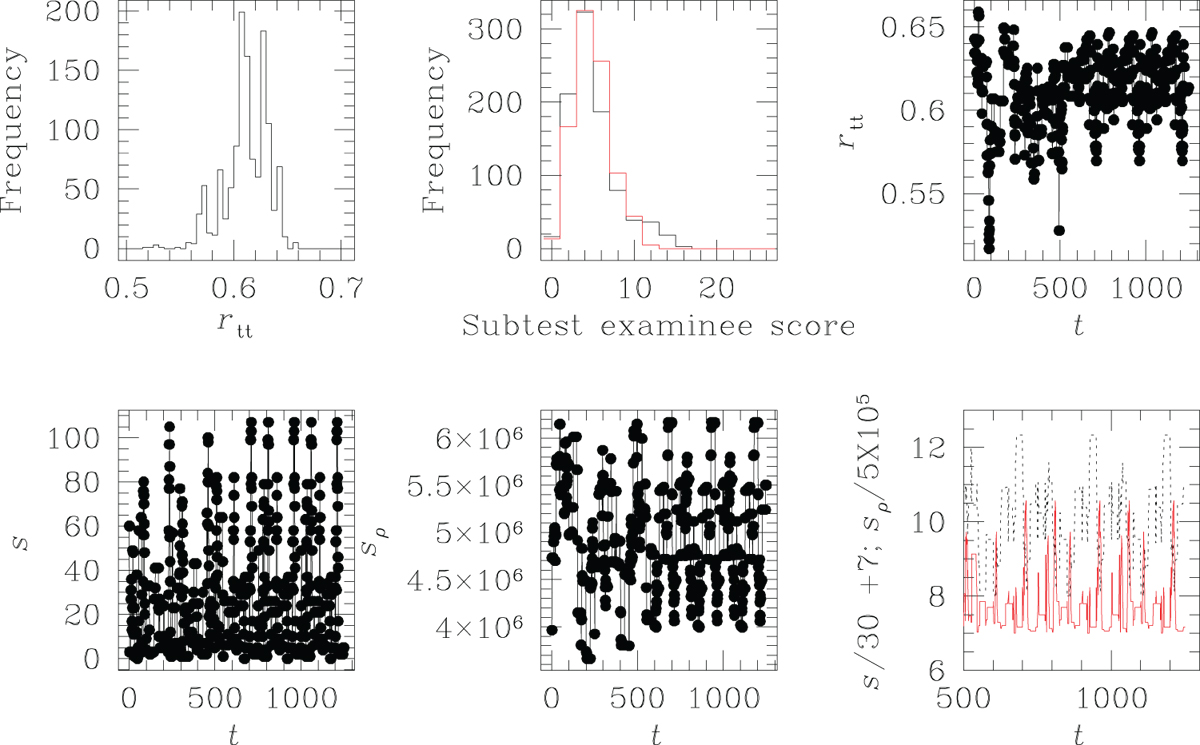
Results of splitting of the real test data DATA-I, into g-th and h-th subtests of equal (=25) number of items, using minimisation of S, i.e. minimisation of the absolute difference between sum of components of item score vectors in the 2 subtests. Lower left: plot of value s of S at the t-th splitting of the test into the g-th and h-th subtests, where the current splitting index t : =25 (ℓ − 1) + j, with l the current iteration number, and j the current swap number; ℓ = 1, … , 50, j = 1, … , 25. An iteration comprises 25 distinct swaps, where a “swap” is defined for this method, in Definition 1. Lower middle: plot against t of value sρ of Sρ which is the inner product of item score vectors of g-th and h-th subtests. Lower right: plot of linearly transformed S and Sρ values, against splitting index t, to empirically verify the equivalence between maximisation of Sρ and minimisation of S (in thin solid lines). scaling and translation of S and Sρ are undertaken to allow the transformed variables to be plotted within a given interval that allows for their easy visual comparison. Also, to enable such visualisation, we focus on a sub-interval of the values of t relevant to this run (≥500). Upper right: plot of reliability rtt as computed by our definition (Eq. (4)), against splitting index t. Upper left: histogram of the rtt values obtained from this run that attains splitting of the given DATA-I test dataset, using minimisation of S. Upper middle: histograms of examinee scores obtained at the last accepted swap, in the g-th (in dark solid lines) and h-th subtests (in grey, or red in the electronic version of the paper), identified in this step.
Current usage metrics show cumulative count of Article Views (full-text article views including HTML views, PDF and ePub downloads, according to the available data) and Abstracts Views on Vision4Press platform.
Data correspond to usage on the plateform after 2015. The current usage metrics is available 48-96 hours after online publication and is updated daily on week days.
Initial download of the metrics may take a while.