Fig. 4
Download original image
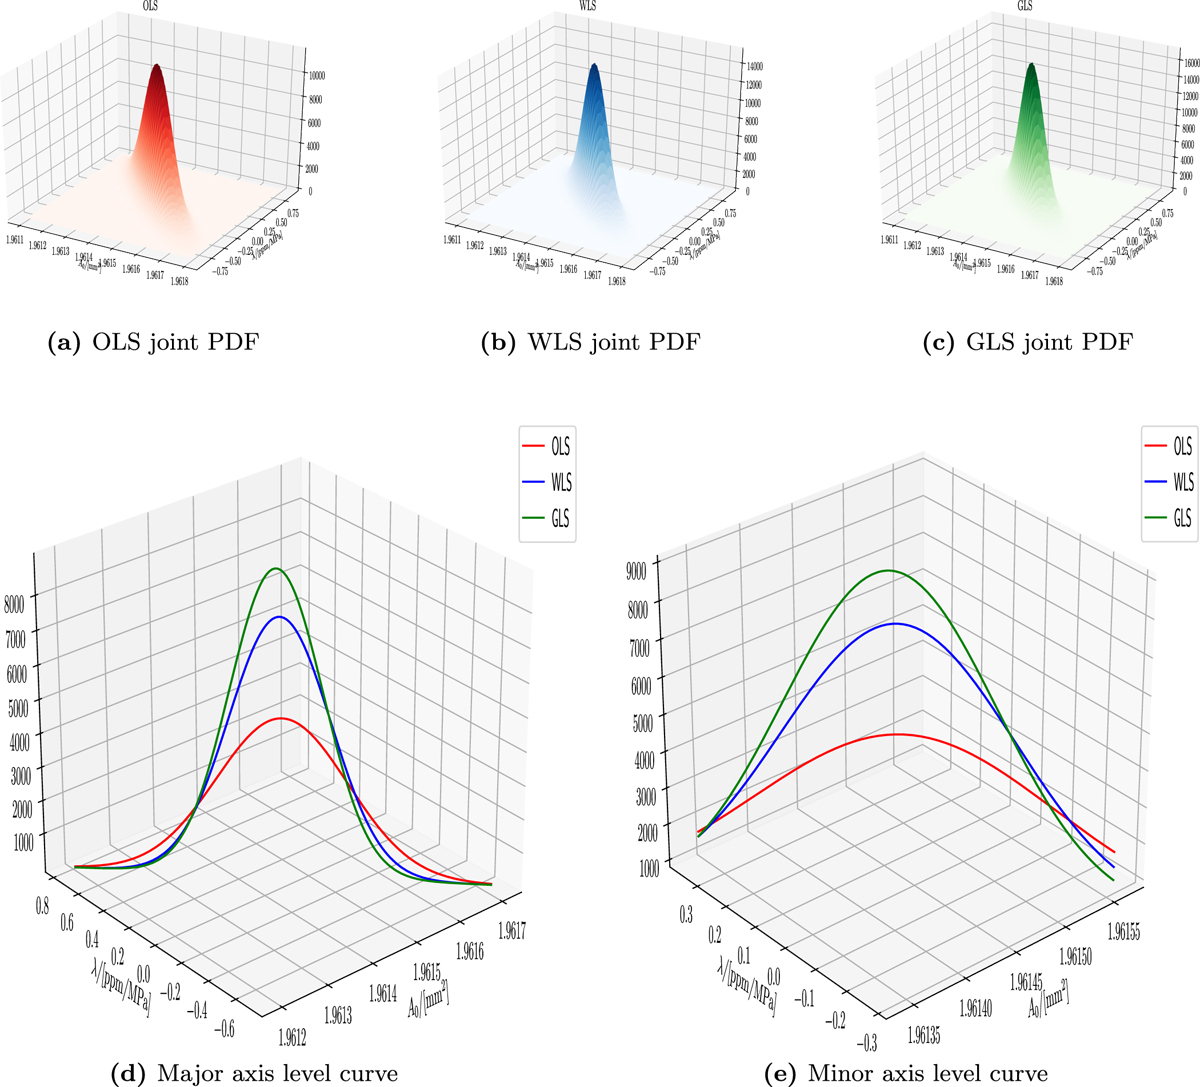
Comparison of joint PDFs from OLS, WLS and GLS regressions. The confidence region may be visualized as a three dimensional volume underneath the envelope covered by the joint PDF and bounded by the hyper-ellipsoids, and indicates that the joint PDFs may fit inside one another. Due to the difficulties with visualizing three different joint PDFs intersecting within each other simultaneously, cuts along the major axis (orange line in previous figure) and minor axis (magenta line in previous figure) of the ellipsoids confidence regions are taken which produce level curves to more easily visualize the shape, orientation and size of the different OLS, WLS and GLS regression schemes. From these level curves it is observed that for level curves along the ellipsoid major axis that the GLS regression (green curve) has the narrowest/sharpest curve which corresponds to the highest confidence or accuracy in the estimates of the parameters, then the WLS regression (blue curve) which has a medium spread/sharpness, and finally the OLS regression (red curve) which is relative wide and flat which corresponds to less certainty/accuracy of the parameters in the regression analysis. A broadly similar behaviour is observed for level curves cut along the minor ellipsoid axis, and as a result it is observed and concluded a OLS regression has the least accuracy, a WLS regression has a medium accuracy, and a GLS regression has the highest accuracy. From the above graphs it may be concluded that a straight line regression for pressure metrology work should ideally utilize a GLS regression (green line) however if no covariance information is available the a WLS regression (blue line) can give a reasonable estimate particularly for industrial pressure metrology laboratories.
Current usage metrics show cumulative count of Article Views (full-text article views including HTML views, PDF and ePub downloads, according to the available data) and Abstracts Views on Vision4Press platform.
Data correspond to usage on the plateform after 2015. The current usage metrics is available 48-96 hours after online publication and is updated daily on week days.
Initial download of the metrics may take a while.