Fig. 8
Download original image
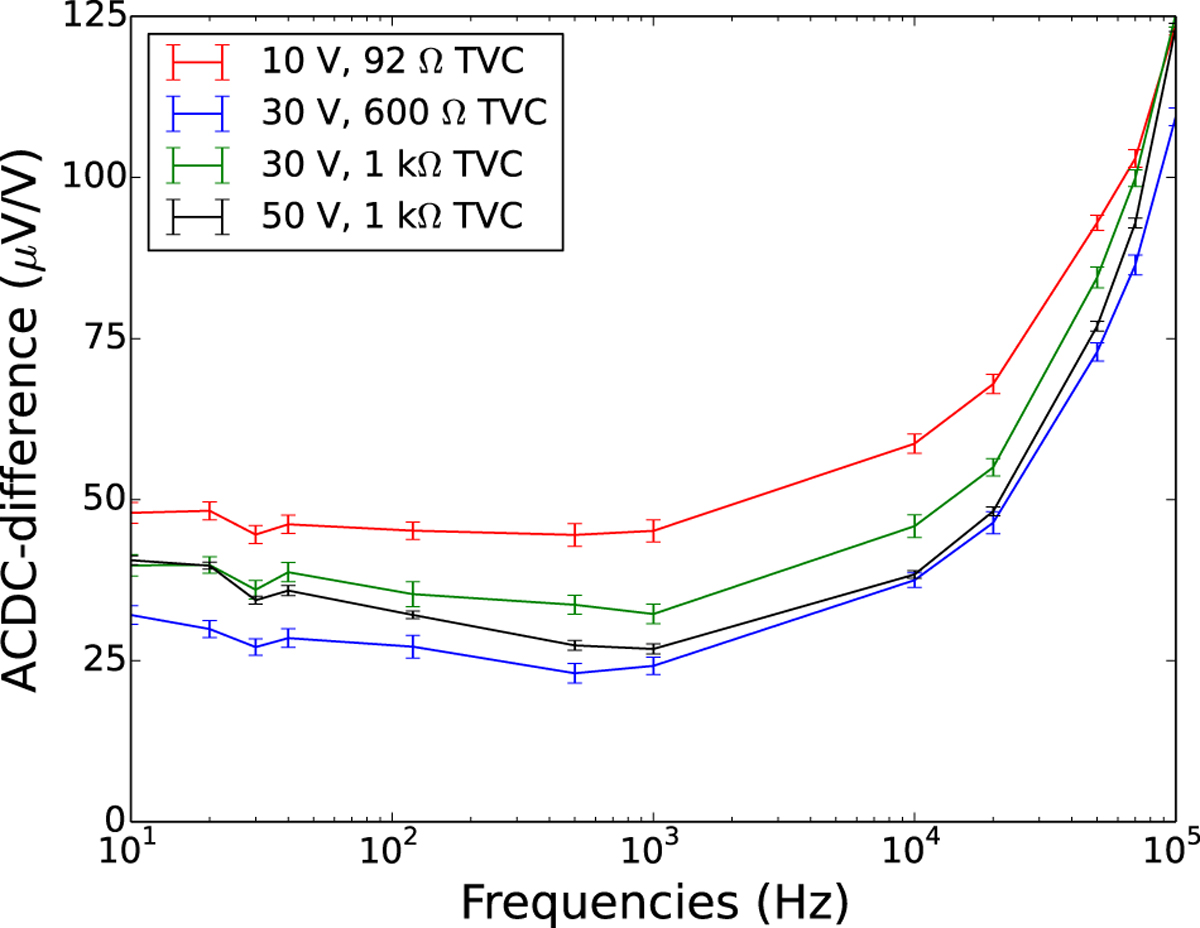
Resulting ac–dc difference for the divider and buffer combination from 10 Hz up to the maximum capability of the calibrator. Red curve contains the measurements for 10 V, blue curve contains the measurements for 30 V, and black curve contains the measurements for 50 V. The green curve contains the measurements for 30 V, by using the references used for 50 V.
Current usage metrics show cumulative count of Article Views (full-text article views including HTML views, PDF and ePub downloads, according to the available data) and Abstracts Views on Vision4Press platform.
Data correspond to usage on the plateform after 2015. The current usage metrics is available 48-96 hours after online publication and is updated daily on week days.
Initial download of the metrics may take a while.