Fig. 4
Download original image
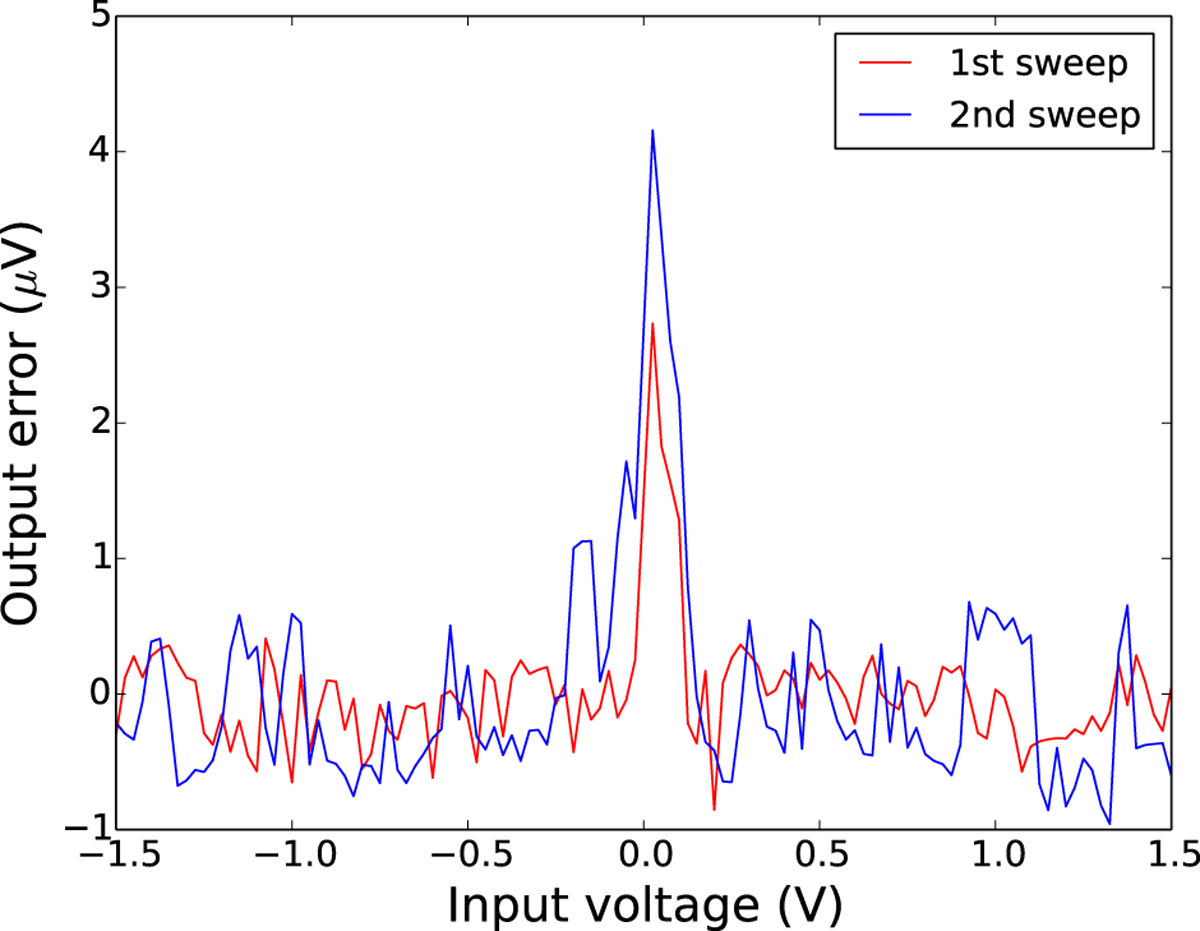
Resulting error in the linear regressions (parameters found given in Tab. 1) of the two dc sweeps performed on the buffer. The first sweep is in red and the second sweep is in blue. The deviation is well within the ±1 μV band over the entire sweep between ±1.5 V with the exception of small section around 0 V. Here the output deviation peaks, but it is still less than 5 μV, and is due to the slight mismatch in the manufacturing of the transistors themselves since this feature is not found in the simulation presented on the top of Figure 2.
Current usage metrics show cumulative count of Article Views (full-text article views including HTML views, PDF and ePub downloads, according to the available data) and Abstracts Views on Vision4Press platform.
Data correspond to usage on the plateform after 2015. The current usage metrics is available 48-96 hours after online publication and is updated daily on week days.
Initial download of the metrics may take a while.