Fig. 3
Download original image
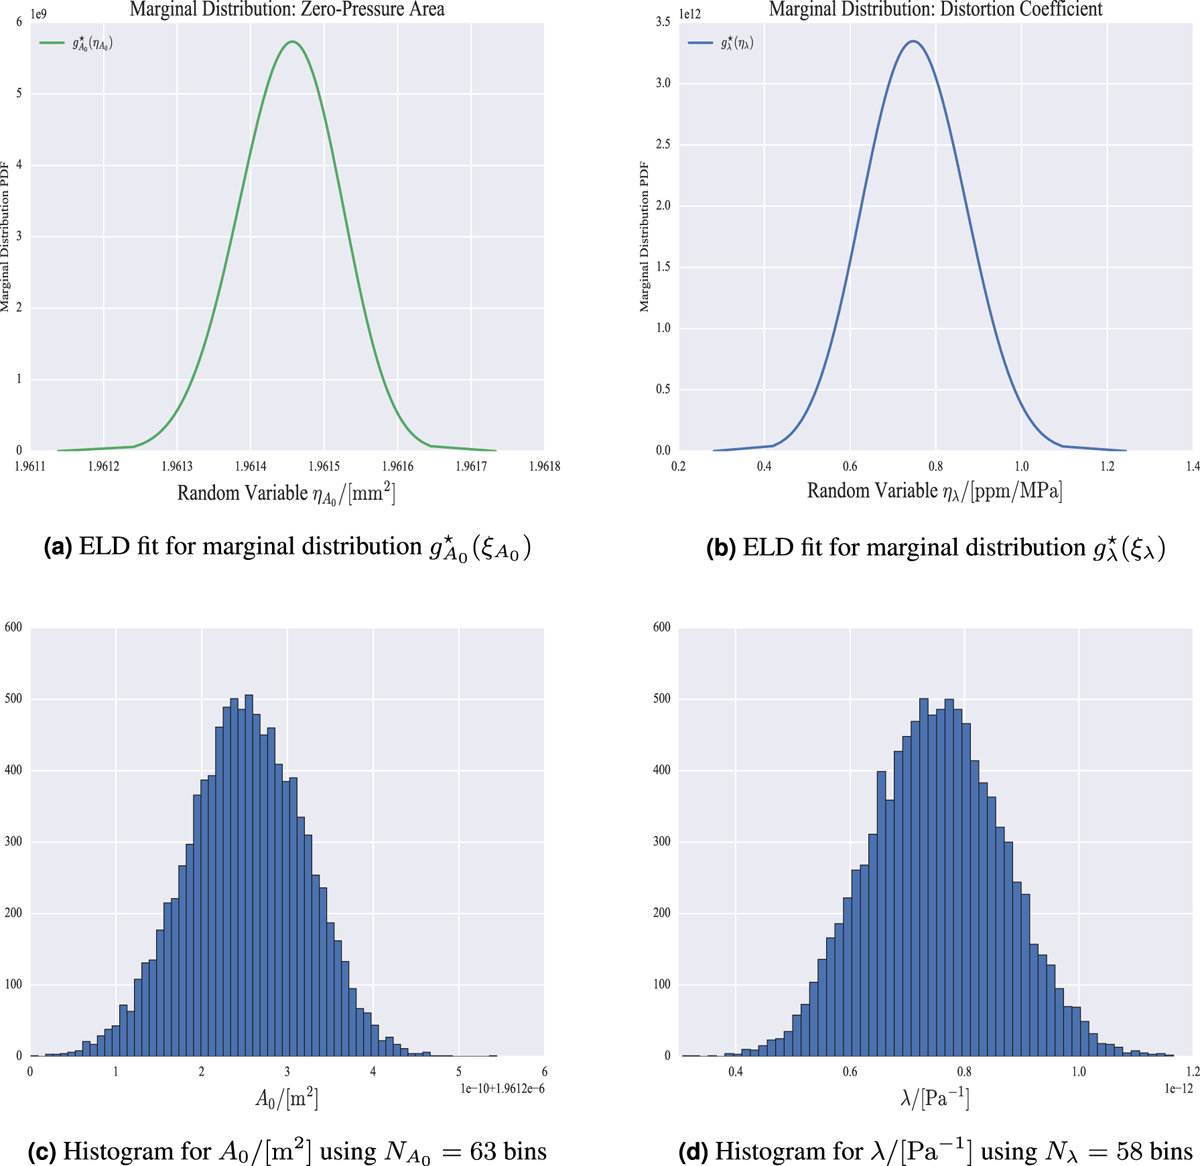
Monte Carlo GUM Supplement 2 marginal distributions. In (a) the probability density function distribution for the continuous random variable ![]() of the zero-pressure area is visualized. In (b) the probability density function distribution for the continuous random variable ξλ of the distortion coefficient is visualized. In (c) the underlying discrete data from the GUM Supplement 2 analysis that is used to build the PDF for the zero-pressure area is shown. In (d) the underlying discrete data from the GUM Supplement 2 analysis that is used to build the PDF for the distortion coefficient is shown
of the zero-pressure area is visualized. In (b) the probability density function distribution for the continuous random variable ξλ of the distortion coefficient is visualized. In (c) the underlying discrete data from the GUM Supplement 2 analysis that is used to build the PDF for the zero-pressure area is shown. In (d) the underlying discrete data from the GUM Supplement 2 analysis that is used to build the PDF for the distortion coefficient is shown
Current usage metrics show cumulative count of Article Views (full-text article views including HTML views, PDF and ePub downloads, according to the available data) and Abstracts Views on Vision4Press platform.
Data correspond to usage on the plateform after 2015. The current usage metrics is available 48-96 hours after online publication and is updated daily on week days.
Initial download of the metrics may take a while.