Fig. 2
Download original image
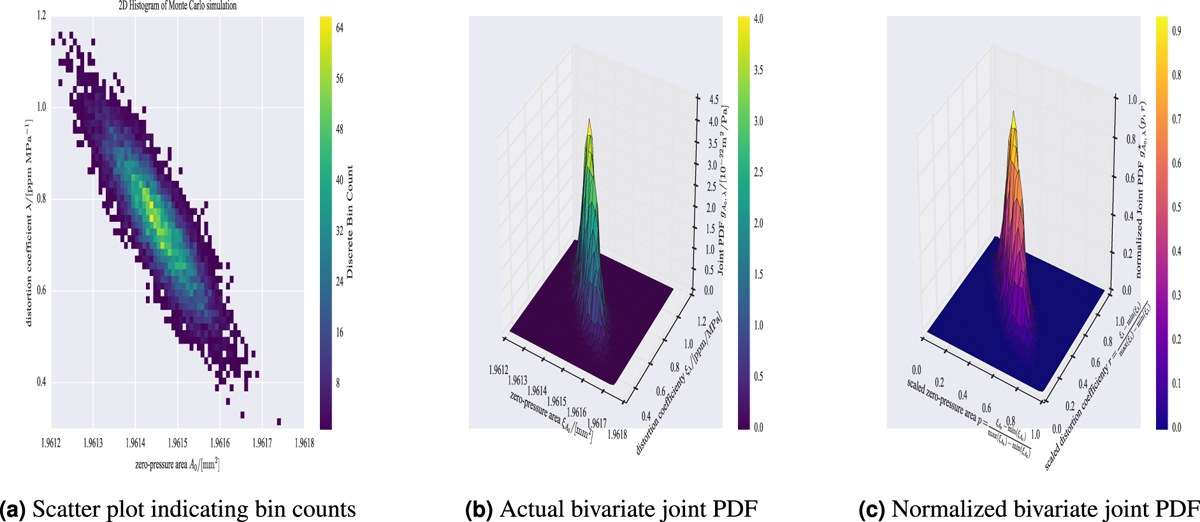
Illustration of Monte Carlo GUM Supplement 2 processed data showing a visualization of the transfer standard pressure balance bivariate joint PDF where the random variables are plotted in physical units such that 106A0/[m2] = A0/[mm2] and 1012λ/[Pa−1] = λ/[ppm/MPa] for easy visualization so that the joint PDF has the correct magnitude for a two dimensional normalization such that ![]() when constructed from the two dimensional histogram data using
when constructed from the two dimensional histogram data using ![]() and Nλ = Ny = 58 bins respectively with M = 10 000 Monte Carlo simulation events. In (a) the actual discrete data of the bivariate joint probability density function is first plotted for a qualitative visualization. In (b) the discrete data is post-processed to produce the mathematically continuous joint probability density function in a three dimensional space where each space coordinate corresponds to a random variable. In (c) the joint probability density function is normalized in order to more clearly view the behaviour of the underlying model.
and Nλ = Ny = 58 bins respectively with M = 10 000 Monte Carlo simulation events. In (a) the actual discrete data of the bivariate joint probability density function is first plotted for a qualitative visualization. In (b) the discrete data is post-processed to produce the mathematically continuous joint probability density function in a three dimensional space where each space coordinate corresponds to a random variable. In (c) the joint probability density function is normalized in order to more clearly view the behaviour of the underlying model.
Current usage metrics show cumulative count of Article Views (full-text article views including HTML views, PDF and ePub downloads, according to the available data) and Abstracts Views on Vision4Press platform.
Data correspond to usage on the plateform after 2015. The current usage metrics is available 48-96 hours after online publication and is updated daily on week days.
Initial download of the metrics may take a while.