| Issue |
Int. J. Metrol. Qual. Eng.
Volume 12, 2021
Topical Issue - Advances in Metrology and Quality Engineering
|
|
|---|---|---|
| Article Number | 10 | |
| Number of page(s) | 6 | |
| DOI | https://doi.org/10.1051/ijmqe/2021008 | |
| Published online | 06 May 2021 | |
Research Article
Rapid non-contact visual measurement method for key dimensions of revolving workpieces
1
Nankai University, College of Computer Science, Tianjin 300071, PR China
2
Tianjin University, State Key Lab Precision Measuring Technology & Instruments, Tianjin 300072, PR China
3
Brunel University London, College of Engineering Design and Physical Sciences, Uxbridge UB8 3PH, UK
* Corresponding author: This email address is being protected from spambots. You need JavaScript enabled to view it.
Received:
3
December
2020
Accepted:
22
April
2021
Abstract
Aimed at the rapid non-contact measurement problem of a revolving workpiece's radial and axial dimensions, a fast and high-precision visual inspection method has been presented in this paper. For the workpiece with large axial size, the proposed method established the measurement transformation chain using the object-image and object-object transformations, thus realizing the rapid axial dimensional measurements. For the workpiece with large radial size, this method determined the measurement transformation model based on two-dimensional target and measurement correspondence relationship, and further achieved rapid radial dimensional measurements. The experimental results have shown that the method is effective and can be applied to in situ dimensional measurement of revolving workpieces on high quality production lines.
Key words: Computer vision / revolving workpiece / real-time / non-contact measurement
© P. Gao et al., Published by EDP Sciences, 2021
 This is an Open Access article distributed under the terms of the Creative Commons Attribution License (https://creativecommons.org/licenses/by/4.0), which permits unrestricted use, distribution, and reproduction in any medium, provided the original work is properly cited.
1 Introduction
Visual measurement technology is widely used in the field of geometric measurement. For the revolving workpieces with small radial or axial size, such as saw blade, ratchet wheel and chip pin, the non-contact measurement methods mainly include image measurement method, laser triangulation method and three-dimensional reconstruction method. Image measurement method is represented by image measuring instrument, which can realize high-precision measurement for some workpieces with small size or thin thickness. However, for large or thick workpieces such as precision shafts, the measurement task is realized step by step based on the combination of image and guide rail, which shows image measurement method is not suitable for real-time applications [1–3]. Laser triangulation method is more mature in surface measurement applications and often integrated in some complex measuring equipment, but it cannot fully meet the requirements of real-time dimensional measurement because of its scanning measurement mode [4–6]. The 3D reconstruction method can obtain the 3D point cloud information. However, the grating fringe information cannot be fully obtained when measuring the reflective metal surface which can easily result in incomplete measurement data [7,8]. This paper presents against the above background a rapid non-contact visual measurement method for key dimensions of revolving workpieces and discusses the key issues of using this method to realize the in situ rapid measurement when the workpiece has large radial and axial dimensions. This method can be applied in situations where the production line has high quality requirements for workpiece inspection [9,10].
2 In situ measurement of key axial dimensions
2.1 Topological structures description of measured objects
The topological structure of the measured objects can be described as radial divergent topological structure, axial parallel arrangement topological structure and spatial expansion topological structure which combines the first two topological structures. As shown in Figure 1, the measured geometric elements include point, line and surface.
 |
Fig. 1 Topological structures of measured objects. |
2.2 Configurations of visual sensors
According to the different features and spatial positions of the axial elements to be measured, the configuration of the visual sensors can be different. These configurations include linear layout, diagonal layout and mirror layout, as shown in Figure 2a–c, respectively. Since the measured features are distributed in the image fields of different vision sensors, it is necessary to study the in situ calibration methods of the sensors with different distributions.
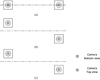 |
Fig. 2 Layouts of visual sensors. (a) linear. (b) diagonal. (c) mirror. |
2.3 In situ calibration method
For the calibration problem of visual sensors with spatially separated and non-overlapping image fields, the transformation process of the calibration method is shown in Figure 3, including the projection matrix M1 between visual sensor 1 and target 1, the projection matrix M2 between visual sensor 2 and target 2 and the transformation matrix M′ between M1 and M2. The transformation chain can be established by M1→M′→M2 transformation, as shown in equation (1), which can be applied to realize the scene pose calibration between the visual sensors. For perspective projection model, M1 and M2 can be obtained by accurate pose estimation method; for parallel projection model, M1 and M2 can be obtained by calibration calculation. Therefore, the calibration method only needs to keep the M′ transformation. When the axial dimension is small, the common transformation matrix M′ can be obtained by the conversion of two targets' marked points which are measured through flexible joint manipulator. When the axial dimension is large, the plane coordinate system of the two targets can be aligned by a total station theodolite and M′ can be obtained by using the coordinate transformation. (1)
(1)
In equation (1), P1 ( ) and P2 (
 ) are the internal and external parameter matrices between the camera and the target respectively, which can be obtained by separating the internal and external parameters. R and T are the space transformation matrix and position vector respectively.
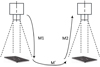 |
Fig. 3 Illustration of measurement transformation chain. |
2.4 Implementation process
The typical implementation process is as follows:
-
The measured workpiece arrives at the measurement station;
-
The position status of the workpiece is obtained by externally triggered photoelectric sensors;
-
The photoelectric sensors' signal triggers two vision sensors to take photos;
-
The visual processing terminal realizes the in situ real-time measurement through the transformation chain relationship and internal parameters obtained from calibration.
3 In situ measurement of key radial dimensions
3.1 Configuration of visual sensors
According to the different shapes and spatial positions of the radial elements to be measured, different configurations of visual sensors may be used, including monocular visual sensing and multi-view sensing. The multi-view sensing may be further divided into face-to-face layout, back-to-back layout and parallel layout, as shown in Figure 4a–c, respectively. Different from the key axial dimensional measurement, the measurement area of the visual sensor only sees part of the geometry. The other part of the geometry is the revolving center of the workpiece outside the field of view. Therefore, it is necessary to establish the transformation measurement model and design the in situ calibration method to realize the rapid measurement.
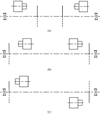 |
Fig. 4 Layouts of vision sensor. (a) face-to-face. (b) back-to-back. (c) parallel. |
3.2 In situ calibration method
The transformation measurement model of a single visual sensor is shown in Figure 5. How to establish the transformation relationship between the target and the revolving center is the key to accomplish the measurement task. The transformation relationship is shown in equation (2). In the case of small radial sizes, the 3D target with known parameters can be designed to determine the rigid transformation relationship between the two. In the case of larger radial sizes, the separation calibration method can be used. The coordinate data of the revolving center line is fitted by the measurement of flexible joint manipulator. Then the marked hole position of the target is measured. The spatial transformation matrix between the two is obtained through coordinate transformation and pose calculation. Combined with the internal and external calibration parameters between the visual sensor and the target, the fast in situ radial measurement of the workpiece can be realized. (2)
(2)
In equation (2), P1 and P2 are the internal and external parameter matrices between the camera and the target respectively. The two matrices can be obtained by internal and external separate parameter calculations. R and T are the spatial transformation matrix and position vector respectively. The point cloud data of the reference axis A is obtained by center fitting method.
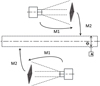 |
Fig. 5 Schematic diagram of measurement transformation chain. |
3.3 Implementation process
The implementation process is as follows:
-
The measurement workpiece arrives at the measurement station;
-
The position status of workpiece is obtained by externally triggered photoelectric sensors;
-
The photoelectric sensors' signal triggers the monocular or multi-view sensors to take photos;
-
The visual processing terminal realizes in situ real-time measurement through the loaded calibration model and its own calibration parameters.
4 Experimental results
In the experimental setup, the high-precision revolving fixture and fine-tuning device are first designed. The parallel projection of bidirectional visual detection device is then established. Finally, the transformation accuracy verification experiment is accomplished. The experimental setup is shown in Figure 6, with the measurement data shown in Table 1. The error distribution curves are shown in Figure 7. The experimental results have verified the effectiveness of the proposed method.
As shown in Figure 7, the absolute error is distributed between 0 and 0.025 mm, indicating that the method has good consistency in the measurement results of the same element. The relative error is less than 0.046%, indicating that the measurement results of different groups have good reliability. The statistical results of standard deviation reflect that the method in this paper has a small random error and can achieve high measurement accuracy.
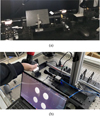 |
Fig. 6 Experimental setup. (a) Photo of detection device. (b) Measurement accuracy verification experiment. |
Experimental results (mm).
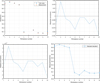 |
Fig. 7 Error distribution curve. |
5 Conclusion
This paper presented a rapid non-contact visual measurement method for key dimensions of revolving workpieces. The proposed method solves the key problems of fast in situ dimensional measurement of revolving workpieces by constructing measurement transformation chain, especially for the situation where the radial and axial dimensions of the workpiece are large and beyond the scope of image field. The method has achieved high measurement accuracy in the designed experiments and has the flexibility in increasing the number of visual sensor nodes. If the nonlinear optimization method of spatial attitude calculation is utilized, the accuracy can be further improved. This method will find applications for the quality control of key dimensions in workpiece inspection.
References
- H. Zou, R. Jia, C. Zhang, Precision compensation method for positioning error of working table of vision measuring machine based on machine vision, Laser Optoelectron. Prog. 55, 208–215 (2018) [Google Scholar]
- B.H. Wang, Y.-H. Kang, S.-H. Sun, A calibration method for large-scale imaging probe measuring machines based on line scale stitching, Acta Metrol. Sin. 40, 8–11 (2019) [Google Scholar]
- D. Tang, Y. Zeng, Y. Fu, B. Zhang, Calibration device for test sieves based on image measuring instrument, in: 2018 5th International Conference on Systems and Informatics (ICSAI), Nanjin, 2018, pp. 717–721 [Google Scholar]
- Z. Dong, X. Sun, W. Liu, H. Yang, Measurement of free-form curved surfaces using laser triangulation, Sensors 18, 10 (2018) [Google Scholar]
- V.I.M. Oliva, E. Román‐Hernández, E. Torres‐Moreno et al., Measurement of quality test of aerodynamic profiles in wind turbine blades using laser triangulation technique, Energy Sci. Eng. 7, 5 (2019) [Google Scholar]
- H. Kosler, U. Pavlovi, M. Jezerek et al., Adaptive robotic deburring of die-cast parts with position and orientation measurements using a 3D laser-triangulation sensor, Stroj. Vestn. 62, 207–212 (2016) [Google Scholar]
- Z. Zhang, J. Yu, N. Gao, Z. Meng, Three-dimensional shape measurement techniques of shiny surfaces, Infrared Laser Eng. 49, 104–116 (2020) [Google Scholar]
- G. Babaie, M. Abolbashari, F. Farahi, Dynamics range enhancement in digital fringe projection technique, Precis. Eng. 39, 243–251 (2015) [Google Scholar]
- J. Zhang, Z. Wang, S. Ye et al., Verticality detection algorithm based on local image sharpness criterion, Chin. J. Mech. Eng. 25, 173–178 (2012) [Google Scholar]
- Z. Wang, Z.W. Wang et al., Semi-automatic inspecting instrument for watch escape wheel based on machine vision, in: 7th International Symposium on Precision Engineering Measurements and Instrumentation (ISPEMI), Lijiang, China, 2011, p. 8321 [Google Scholar]
Cite this article as: Peipei Gao, Feng Liu, Xizhi Sun, Fang Wang, Jiajun Li, Rapid non-contact visual measurement method for key dimensions of revolving workpieces, Int. J. Metrol. Qual. Eng. 12, 10 (2021)
All Tables
All Figures
|
Fig. 1 Topological structures of measured objects. |
| In the text | |
|
Fig. 2 Layouts of visual sensors. (a) linear. (b) diagonal. (c) mirror. |
| In the text | |
|
Fig. 3 Illustration of measurement transformation chain. |
| In the text | |
|
Fig. 4 Layouts of vision sensor. (a) face-to-face. (b) back-to-back. (c) parallel. |
| In the text | |
|
Fig. 5 Schematic diagram of measurement transformation chain. |
| In the text | |
|
Fig. 6 Experimental setup. (a) Photo of detection device. (b) Measurement accuracy verification experiment. |
| In the text | |
|
Fig. 7 Error distribution curve. |
| In the text | |
Current usage metrics show cumulative count of Article Views (full-text article views including HTML views, PDF and ePub downloads, according to the available data) and Abstracts Views on Vision4Press platform.
Data correspond to usage on the plateform after 2015. The current usage metrics is available 48-96 hours after online publication and is updated daily on week days.
Initial download of the metrics may take a while.