| Issue |
Int. J. Metrol. Qual. Eng.
Volume 8, 2017
|
|
|---|---|---|
| Article Number | 19 | |
| Number of page(s) | 9 | |
| DOI | https://doi.org/10.1051/ijmqe/2017009 | |
| Published online | 09 June 2017 | |
Research Article
NIS method for uncertainty estimation of airborne sound insulation measurement in field
Department of Acoustics, Mass and Force Metrology Division, National Institute for Standards (NIS),
Giza, Egypt
⁎ Corresponding author: This email address is being protected from spambots. You need JavaScript enabled to view it.
Received:
1
October
2016
Accepted:
2
May
2017
Abstract
In structures, airborne sound insulation is utilized to characterize the acoustic nature of barriers between rooms. However, the assessment of sound insulation index is once in a while troublesome or indeed, even questionable, both in field and laboratory measurements, notwithstanding the way that there are some unified measurement methodology indicated in the ISO 140 series standards. There are issues with the reproducibility and repeatability of the measurement results. A few troubles might be brought on by non-diffuse acoustic fields, non-uniform reverberation time, or blunders of the reverberation time measurements. Some minor issues are additionally postured by flanking transmission. In this paper, investigation of the uncertainties of the above specified measurement parts and their impact on the consolidated uncertainty in 1/3-octave frequency band. The total measurement uncertainty model contributes several different partial uncertainties, which are evaluated by the method of type A or type B. Also, the determination of the sound reduction index decided by ISO 140-4 has been performed.
Key words: sound insulation / sound reduction index / reverberation time / uncertainty
© T.M. El-Basheer et al., published by EDP Sciences, 2017
 This is an Open Access article distributed under the terms of the Creative Commons Attribution License (http://creativecommons.org/licenses/by/4.0), which permits unrestricted use, distribution, and reproduction in any medium, provided the original work is properly cited.
1 Introduction
In structures, the airborne sound insulation is utilized for evaluation of the acoustic nature of barriers between rooms. However, the assessment of acoustic insulation seems to be troublesome, even here and there uncertain, not just in the field conditions, in any case, additionally in the lab, regardless of the way that there are bound together measurement strategies indicated in the ISO 140 [1] and ISO 717 [2] guidelines. While in the field conditions, a few issues may be experienced with satisfying all the standard prerequisites, especially in evaluation of flanking transmission, there should be no such issues, or to an exceptionally constrained degree, in the research facility conditions.
Airborne sound insulation measurement of interior dividing walls, ceilings, and doors between adjacent rooms in buildings is performed in accordance with ISO 140-4:1998 [3]. Different studies have already been published in the literature, mostly related to standard 140-4 [4–7]. The standard ISO 140 describes how the measurements of acoustic insulation of buildings and constructive elements must be carried out. In particular, the in situ measurements of airborne sound insulation between rooms have been performed following the procedure described in [3]. The uncertainty of a measurement result is defined in the International Guide to the Expression of Uncertainty in Measurement, ISO/IEC Guide 98 [8], called GUM, which standardizes how to determine and evaluate it.
In Egypt, there are few laboratories and research institutions such as NIS – National Institute for Standards and some private manufacturers having in-house R&D centre's engaged in sound transmission loss testing in frequency range 100 Hz–4 kHz. The idea of uncertainty has been brought into metrological practice therefore of global traditions [9] with the end goal of communicating the consequences of any single measurement of any research center. Estimation of measurement uncertainty depends on the hypothesis of probability, numerical statistics and on the law of uncertainty distribution. The primary objective of this paper is to provide a quantitative assessment of the factors that contribute to the uncertainty in the measurement of airborne sound insulation at the field to construct uncertainty budget that satisfies with the international standards. So, the present work gives a perspective of calculating the measurement uncertainty in the sound reduction index in 1/3-octave bands.
2 Materials and method
2.1 Measurement of airborne sound insulation
2.1.1 Description of item under test
Demountable partitions are composed of aluminum posts, sub-beams, floor tracks, and ceiling tracks. Panels are composed of 18 mm thick melamine or natural veneer faced MDF (medium-density fiber board). In floor and ceiling tracks, posts are sub-beams, encased in black neoprene covers. Space between panels and inside floor and ceiling tracks filled with rock wool was with a density of 52 kg/m3. Total partition thickness was 100 mm. The equipment is checked regularly in accordance with the NIS guidelines.
2.1.2 Mounting in the room
The mounting was carried out by the client (Contact Interior Co.). The joints between the frame and the test opening were sealed from both sides with silicon. Loudspeaker system: omni power sound source. Sound signal wideband pink noise was used (Fig. 1).
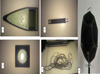 |
Fig. 1 (a) Used sound level meter, (b) microphone with pre-amplifier, (c) calibrator for noise measurement, (d) stand, cable, and (e) used loud speaker. |
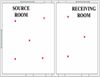 |
Fig. 2 Adjacent rooms and red point refer to the microphone position. |
2.1.3 Test facilities
-
Source room: volume 108 m3
-
Receiving room: volume 67 m3
-
Area of the sample: 7.9 m2
2.1.4 Measurement procedure
Pink noise was generated in the source room and the measured data were registered using 2260 sound level meter. Five different positions were also taken for measurements of sound pressure levels in the source room (Fig. 2). Three different positions were taken also for measurements of sound pressure levels in the receiving room. The reverberation time (RT) was measured at three microphone positions in the receiving room. Filters: 1/3-octave band filters with center frequencies were within the frequency range 100–5000 Hz. Background noise levels are measured to ensure that observations in the receiving room are not affected by extraneous noise sound, with such noise coming from outside the test room.
The sound reduction index (R) is evaluated by equation (1) [10,11]:
 (1)
where L1: average sound pressure level in the source room, dB; L2: average sound pressure level in the receiving room, dB; S: area of test specimen, m2; A: equivalent sound absorption area in the receiving room.
(1)
where L1: average sound pressure level in the source room, dB; L2: average sound pressure level in the receiving room, dB; S: area of test specimen, m2; A: equivalent sound absorption area in the receiving room.
2.2 Estimation of uncertainty
If the measured or predicted noise level depends on many input values, then the final result is a function of many arguments (Eq. (2)) [5,12].
 (2)
where Lout = the measurand, which is determined by m directly measured quantities Xin1, Xin2, …, Xinm (input variables). Everyone of them carries some standard uncertainty U(Xini). Combined standard uncertainty
(2)
where Lout = the measurand, which is determined by m directly measured quantities Xin1, Xin2, …, Xinm (input variables). Everyone of them carries some standard uncertainty U(Xini). Combined standard uncertainty  , under assumption that the individual arguments in equation (2) are independent, can be calculated using equation (3).
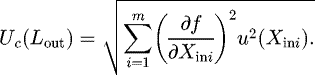 (3)
(3)
The uncertainty provided together with the measurement result is a multiplicity of the combined standard uncertainty and is usually called an extended uncertainty. Equations (1) and (3) have been used for analysis of sensitivity of the combined uncertainty with respect to its individual components. The uncertainties of the measurements of acoustic pressure levels and reverberation times belong to the type A standard uncertainties, whereas all the other ones belong to the type B.
Apparent sound reduction index measurement model is given by equation (4) [3,11]:
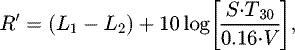 (4)
where L1 is energy-average sound pressure level in broadcast room, L2 is energy-average sound pressure level in receiving room, S is area of dividing element in m2, V is volume in receiving room in m3, T30 is average reverberation time in receiving room in seconds.
(4)
where L1 is energy-average sound pressure level in broadcast room, L2 is energy-average sound pressure level in receiving room, S is area of dividing element in m2, V is volume in receiving room in m3, T30 is average reverberation time in receiving room in seconds.
Assuming that the input quantities are not correlated, then for combined standard uncertainty u(R′) holds relation [11]:
 (5)
uA(L1) is standard uncertainty estimate of sound pressure levels in broadcast room, evaluated by the method A. uA(L2) is standard uncertainty estimate of sound pressure levels in the receiver room, evaluated by the method A. uB(S) is standard uncertainty of determining the area of separating element (structure), evaluated by the method B, uB(V) is standard uncertainty of determining the volume of the receiving room, evaluated by the method B, and uA(T30) is standard uncertainty of reverberation time estimation in the receiving room, evaluated by the method A.
(5)
uA(L1) is standard uncertainty estimate of sound pressure levels in broadcast room, evaluated by the method A. uA(L2) is standard uncertainty estimate of sound pressure levels in the receiver room, evaluated by the method A. uB(S) is standard uncertainty of determining the area of separating element (structure), evaluated by the method B, uB(V) is standard uncertainty of determining the volume of the receiving room, evaluated by the method B, and uA(T30) is standard uncertainty of reverberation time estimation in the receiving room, evaluated by the method A.
2.2.1 Uncertainties evaluated by method A
Estimated energy-average sound pressure level in transmitting (source) and receiving rooms for each 1/3-octave band in the required number of microphone positions L1j, L2j is given by equation (6) [13]
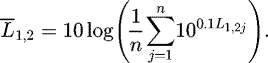 (6)
(6)
From the average sound pressure level, the standard deviation σ(L1,2) of the pressure levels measured at the different points of the source and receiving rooms has been estimated according to equation (7) [13].
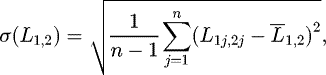 (7)
and standard uncertainty of this estimation
(7)
and standard uncertainty of this estimation
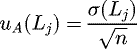 (8)where σ(Lj) is standard deviation of the n-measured sound pressure level values, and n is the total number of measured values of sound pressure level.
Estimated average reverberation time in the receiving room for each 1/3-octave band in required number of microphone positions (m ≥ 6) is given by relation
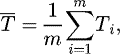 (9)
and standard uncertainty of this estimation
(9)
and standard uncertainty of this estimation
 (10)where σ(Tj) is the standard deviation of the m-reverberation time measured values, and m is the total number of measured values of reverberation time in the receiving room.
2.2.2 Uncertainties evaluated by method B
Sources of sound level meters errors due to operational characteristic are divided into frequency-dependent and frequency-independent. If the deviations Δi of given source zi, values of expanded uncertainty U and coverage (extension) factor k reported in calibration certificates or technical documentation, etc., then standard uncertainty uB(zi)
 (11)
(11)
In case only tolerances of allowed variations ±zi,max from nominal value of given source zi are given, then standard deviation uB(zi) is given by
 (12)
where χ is value of chosen probability distribution approximation variation in this interval.
(12)
where χ is value of chosen probability distribution approximation variation in this interval.
Standard uncertainty of determining the area of separating element uB(S) and volume of receiving room uB(V) is usually expressed as percentage and conversion to dB according to the below relationship (Eq. (13)) [11]:
 (13)
(13)
2.2.3 Units for the calculus of the uncertainty
Concerning the units, some authors suggest that it is more adequate to treat the input variables and associated uncertainties in linear scale rather than in dB [14,15] The final combined uncertainty is calculated in natural units, for example, as percentage (%) and then converted into dB. The following expressions could be used for the conversion to percentage.
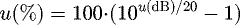 (14)
(14)
2.2.4 Confidence interval
The expanded uncertainty U of a measurement provides an interval within which the value of the mensurand is believed to lie with a high level of confidence. It is the product of a coverage factor k and the combined standard uncertainty of the measurement: U = kuc(y). The factor k is chosen based on the desired level of confidence. In our study, the approximate level of confidence is 95%.
3 Results and discussion
3.1 Sound reduction index and frequency analysis
The results of sound reduction index are presented in the frequency range from 100 to 5000 Hz, because the frequency range 50–80 Hz suffered from inaccuracies. It is clear from Figure 3 that as the frequency increases, the sound reduction index increases. Also, at the frequency of 2000 Hz, there is a dip in the curve due to the coincidence effect, where at this frequency the wavelength of the incident sound coincides with the wavelength of the bending wave inside the panel, and consequently amplification in the amplitude of the bending wave that leads to the transmission of sound without reduction. Above the critical frequency, the transmission loss increases again.
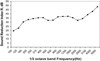 |
Fig. 3 Sound reduction index (R) in 1/3-octave band frequency. |
3.2 Uncertainty components in the acoustic measurements and analysis
The interval within which the value of the measurand (R′) is believed to lie with a high level of confidence is obtained by the expanded uncertainty U of a measurement. It is the product of a coverage factor k and the combined standard uncertainty of the measurement: U = kuc(y).
The uncertainty of a measurement comprises many sources and many components. The ISO guide divides these components into two classes: type A or type B estimations, depending on the method used to estimate their numerical values. Type A evaluation of standard uncertainty is obtained from statistical analysis of the results of series of experimental measurements, like standard deviations. The best estimate xi of an input quantity Xi is given by the arithmetic mean of n statistically independent observations in repeatability conditions. The associated standard uncertainty ui(xi) is given by the average experimental standard deviation, as in equations (8) and (10).
Type B quantities are those for which there are no experimental data from a set of measurements to statistically evaluate their standard uncertainties, but probability distributions based on experience or other information, like calibration certificates, manufacturer's data, or the result of a previous uncertainty evaluation.
The measurand R′, expressed in equation (4), was the chosen parameter for the uncertainty evaluation. The individual uncertainty components were established by: the experimental estimation of individual uncertainty contributions, measured from repeatability experiments and quantified in terms of the average experimental standard deviation of the measured values and from estimation based on data from calibration certificates.
Figure 4 presents average sound pressure levels, L1 and L2 and their standard deviations for the source and the receiving rooms. The sound pressure level in the source room presents slightly higher standard deviations. For this reason, this input quantity contributes more to the total measurement uncertainty as shown in Table 2. The standard deviation values calculated for L1 and L2 are almost coincident. Also, Figure 5 presents the average values of T30 (s) and their standard deviations. Thus we can deduce the type A uncertainties and tabulate it in Table 2.
Careful consideration of each aspect involved in the field measurement is required to identify and list all the factors that contribute to the overall uncertainty. This is a very important step and requires good understanding of the measuring equipment, the principles and practice of the field measurement and the influence of environment. Concerning the environmental effects, the most commonly encountered ones when considering measurement uncertainty are temperature, relative humidity and barometric pressure.
In Table 1, we summarize the uncertainties involved according to expressions that exist in [3] and that we have used for the calculations. In this table, we have shown that uncertainties are standard uncertainty of sound pressure levels estimation UA(L1), UA(L2), standard uncertainty of reverberation time estimation UA(T30) .
In Table 1, we have shown the ones associated to L1 and L2 input variables. The uncertainties associated to the environmental effects have been deduced from the microphone characteristics manual. We have considered as uncertainty the maximum variation that the environmental conditions can introduce in the lecture of the pressure level. The other correction and uncertainty values have been estimated based on data of the sound level calibration certificated. Normally, the sound pressure levels contribute more to the total uncertainty than the reverberation time, so their uncertainty components have been more carefully analyzed.
Our laboratory report proposes the classification of these corrections into two classes:
-
Those related to the correction of sound level meter itself and can be obtained from the values of the electric and acoustic calibration of it (δPFE, δPFA, δRMS, δPT, δPMS).
-
Those related to the sound level meter in use (δTS, δPS, δES). The components of these uncertainties are calculated according to [15] except δLS which is taken from the values given in [16].
Some other contributions could have been taken into account as the operator influence. Some of these factors could be neglected; the reader should include another influence which could be considered in his/her measurement procedure.
It is clear from Table 2 that the values of uncertainty were different at each frequency, where it is ranging from 0.73 up to 2.55 dB. The values of uncertainty are high especially at low frequency, and this may be due to the fact that dimension of the transmission room is small compared to the wavelength of the emitted sound. Table 2 shows the values of the components in dB obtained after an airborne noise insulation measurements according to ISO 140-4. The final combined uncertainty depends on standard deviation of the magnitude L1 and L2 because they have the higher values of uncertainty than other components.
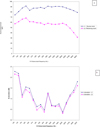 |
Fig. 4 (Top) Average sound pressure levels for L1 (source room) and L2 (receiving room), (bottom) standard deviation for L1 (source room) and L2 (receiving room). |
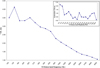 |
Fig. 5 Average values of reverberation time T30 (s) in the receiving room together with standard deviations (inset figure). |
4 Conclusions
This study was done for a client by NIS. This work presented the evaluation of the uncertainty of the results for a set of field independent measurements of sound insulation. The uncertainty estimation is not an easy procedure, since it is difficult to identify all sources of uncertainty related to the measured and a methodology to evidence its metrological confidence should also be applied. Determining uncertainty balance of apparent sound reduction index between adjacent rooms in buildings means, that besides standard uncertainties of type B also standard uncertainties of type A must be taken into account. The values obtained for the uncertainty of the measurement results may exceed 2 dB at some frequencies. The uncertainty estimation needs more detailed studies to be well established. More field measurements with several repetitions are being performed to continue this research. The present investigation shows that in majority of cases for the partition having poor sound insulation characteristics at low frequencies 100 and125 Hz, the uncertainty is higher. It is well known that the uncertainty of sound measurement using the pressure method is large at the low frequency, because the transmission room is small compared to the wavelength.
References
- ISO 10140, Acoustics – Laboratory Measurement of Sound Insulation (2010) [Google Scholar]
- ISO 717-1, Acoustics – Rating of Sound Insulation in Buildings (2013) [Google Scholar]
- ISO 140-4, Acoustics – Measurement of Sound Insulation in Buildings and of Building Elements – Part 4: Field Measurements of Airborne Sound Insulation Between Rooms (International Organization for Standardization, 1998) [Google Scholar]
- R. Nascimento, D. Ferreira, M. Nabuco, in 19th International Congress on Acoustics, Madrid (2007) [Google Scholar]
- T. Wszołek, Arch. Acoust. 32, 271 (2014). [Google Scholar]
- M. Ranny, M. Nbucon, in XIX IMEKO World Congress Fundamental and Applied Metrology, Lisbon, Portugal (2009) [Google Scholar]
- F. Scamoni, C. Mussin, M. Galbusera, E. Bassanino, M. Zambon, G. Radaelle, in EuroNoise09, Edinburgh (2009) [Google Scholar]
- ISO/IEC Guide 98, Guide to the Expression of Uncertainity in Measurement (GUM) (International Organization for Standardization, 1995). [Google Scholar]
- Guide to the Expression of Uncertainty in Measurement, revised edn. (2004) [Google Scholar]
- J. Castillo, M. Sobreira, in 19th International Congress on Acoustics, Madrid (2007) [Google Scholar]
- M. Navacerrada, C. Díaz, A. Pedrero, L. Iglesias, in 39 Congreso Nacional de Acústica, Coimbra, Portugal (2008) [Google Scholar]
- T. Wszołek, Uncertainty of LDEN level estimation for corona noise of UHV transmission lines, in International INCE Symposium, Le Mans (2005) [Google Scholar]
- M.A. Navacerrada, C. Dıaz, A. Pedrero, in Proceedings of Forum Acusticum, Aalborg, Denmark (2011) [Google Scholar]
- J. Castillo Cid, M. Sobreira Seoane, in 19th International Congress on Acoustics, Madrid (2007) [Google Scholar]
- J.A. Mondaray, F.J. Yebra, L. Lorenzo, in 3 Congreso español de metrología, Zaragoza (2005) [Google Scholar]
- A.R. Rodriguez, M. Sobreira Seoane, in 19th International Congress on Acoustics ICA, Madrid (2007) [Google Scholar]
Cite this article as: Tarek M. El-Basheer, Rabab S. Youssef, Hatem Kh. Mohamed, NIS method for uncertainty estimation of airborne sound insulation measurement in field, Int. J. Metrol. Qual. Eng. 8, 19 (2017)
All Tables
All Figures
|
Fig. 1 (a) Used sound level meter, (b) microphone with pre-amplifier, (c) calibrator for noise measurement, (d) stand, cable, and (e) used loud speaker. |
| In the text | |
|
Fig. 2 Adjacent rooms and red point refer to the microphone position. |
| In the text | |
|
Fig. 3 Sound reduction index (R) in 1/3-octave band frequency. |
| In the text | |
|
Fig. 4 (Top) Average sound pressure levels for L1 (source room) and L2 (receiving room), (bottom) standard deviation for L1 (source room) and L2 (receiving room). |
| In the text | |
|
Fig. 5 Average values of reverberation time T30 (s) in the receiving room together with standard deviations (inset figure). |
| In the text | |
Current usage metrics show cumulative count of Article Views (full-text article views including HTML views, PDF and ePub downloads, according to the available data) and Abstracts Views on Vision4Press platform.
Data correspond to usage on the plateform after 2015. The current usage metrics is available 48-96 hours after online publication and is updated daily on week days.
Initial download of the metrics may take a while.