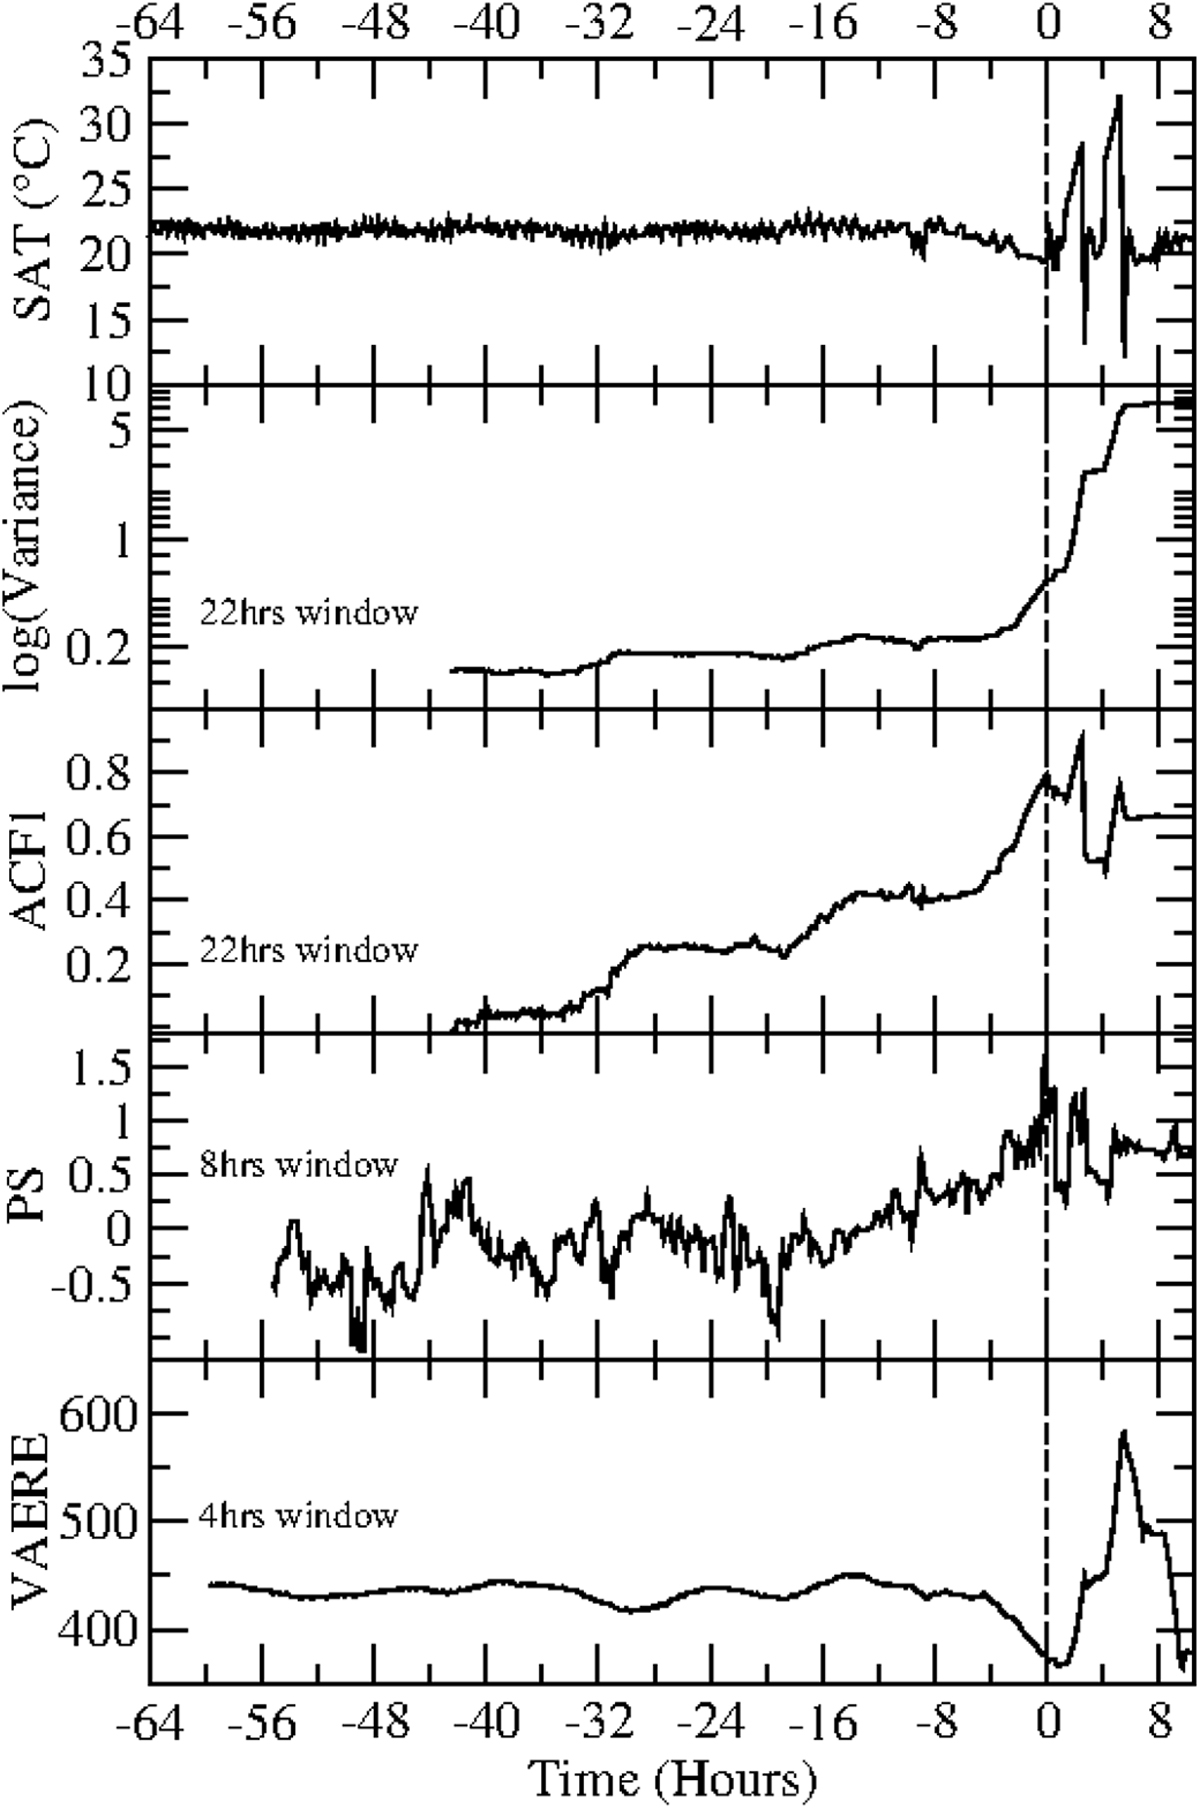
Fig. 2
Download original image
Supply air temperature according to four indicators: variance, auto-correlation function, power spectrum and variational autoencoder. The moment of the failure (when the supply air temperature increases anomalously for the first time) is 9:30AM of the 27th of January 2019. Plot starts at 5:30 AM of the 25th of January, 64 hours prior to the failure. Variance is shown in logarithmic scale to make the increase prior to failure more visible. Window sizes used: 22 hours for variance and ACF1, 8 hours for PS and 4 hours for VAERE.
Current usage metrics show cumulative count of Article Views (full-text article views including HTML views, PDF and ePub downloads, according to the available data) and Abstracts Views on Vision4Press platform.
Data correspond to usage on the plateform after 2015. The current usage metrics is available 48-96 hours after online publication and is updated daily on week days.
Initial download of the metrics may take a while.