Open Access
Fig. 2
Download original image
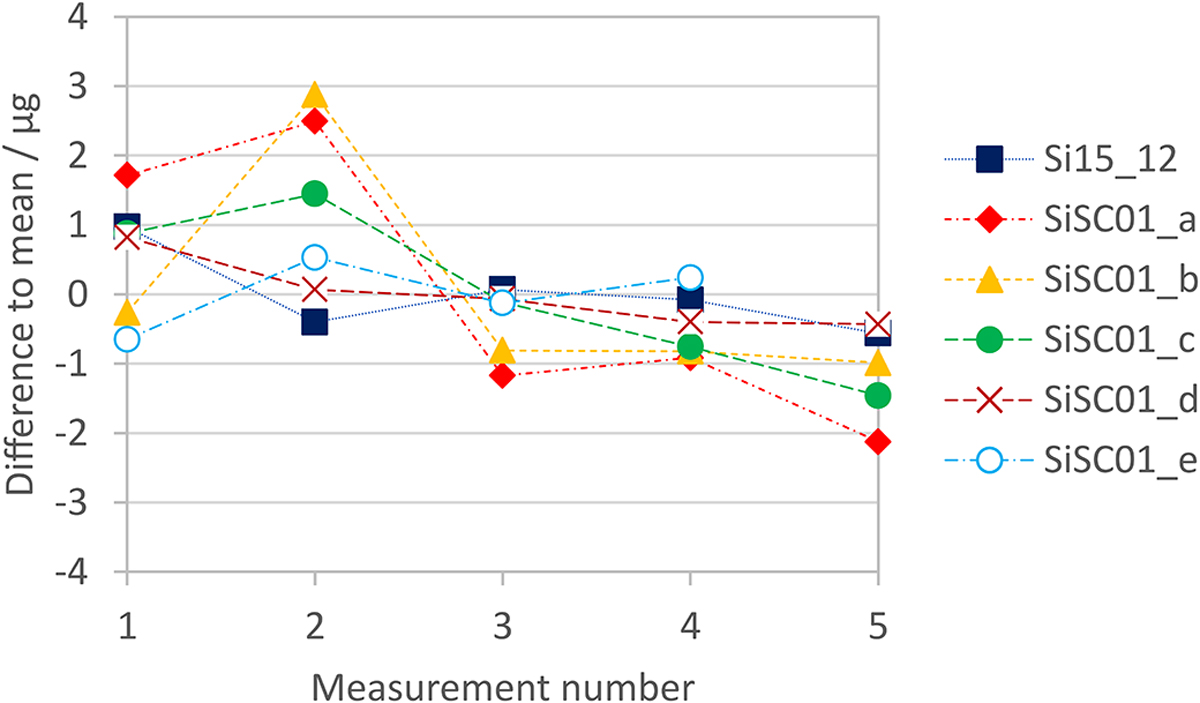
Diagram of the data given in table 3.2.1 for the measured mass differences between the test spheres and the reference sphere (Sm14). The individual mass differences of a sphere are given with respect to their observed mean value (![]() ) [9].
) [9].
Current usage metrics show cumulative count of Article Views (full-text article views including HTML views, PDF and ePub downloads, according to the available data) and Abstracts Views on Vision4Press platform.
Data correspond to usage on the plateform after 2015. The current usage metrics is available 48-96 hours after online publication and is updated daily on week days.
Initial download of the metrics may take a while.